MCV is one of the first red-cell indices I look at when reviewing a CBC. It gives direction quickly.
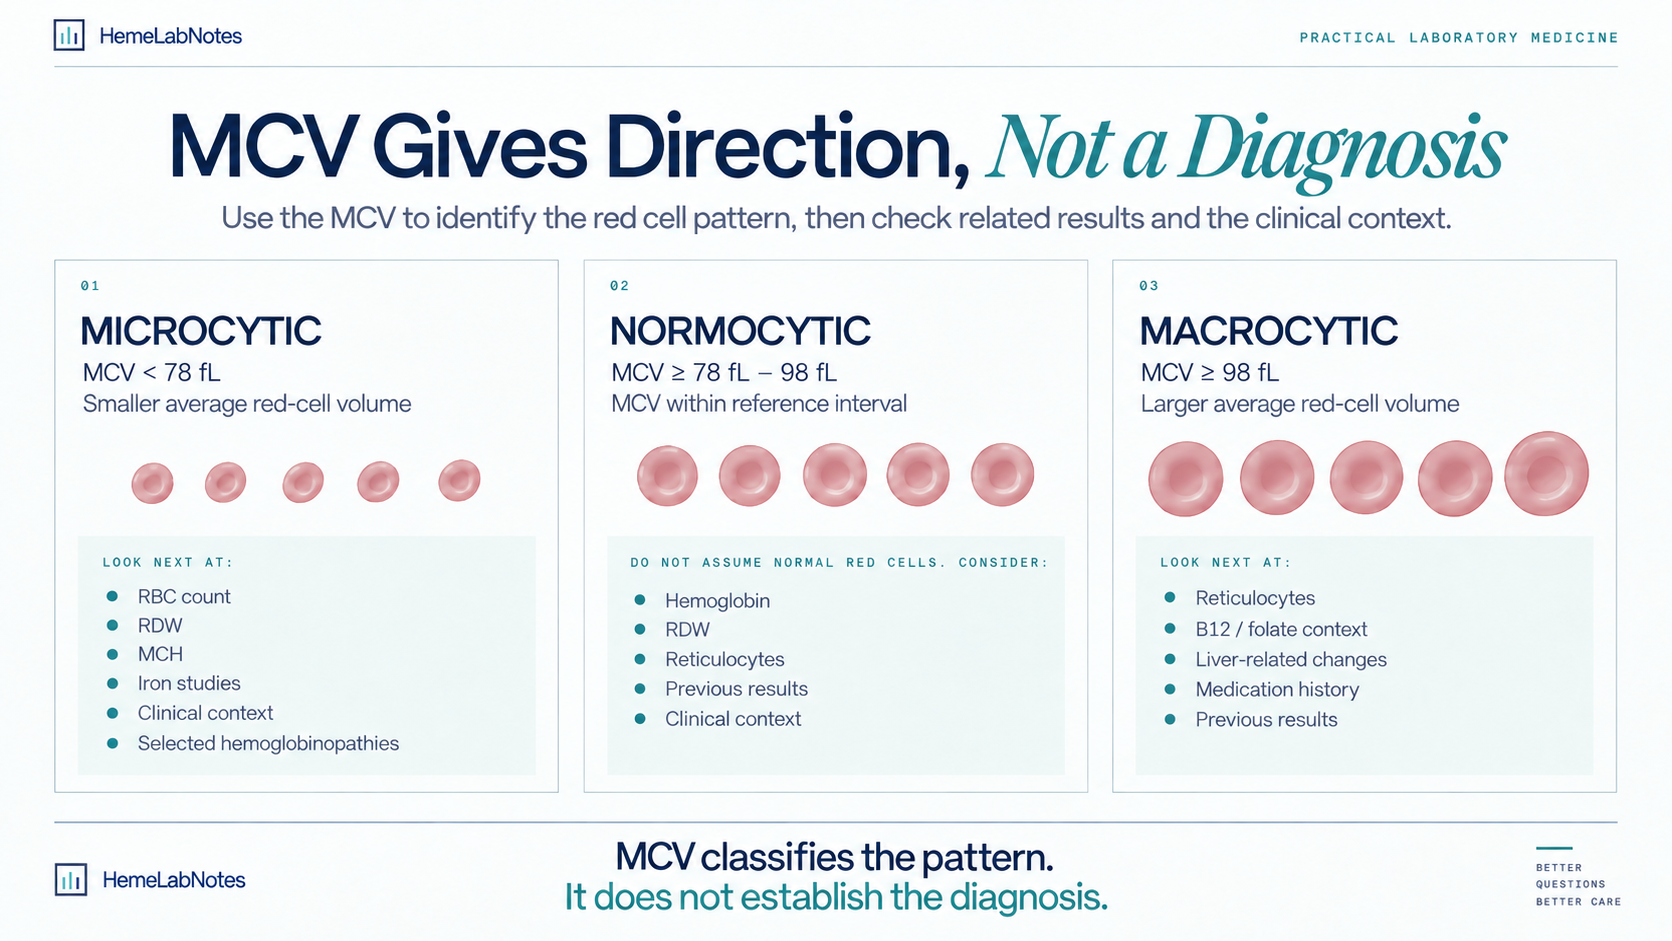
If the MCV is low, I know I am looking at a microcytic pattern. If it falls within the laboratory reference interval, the pattern is normocytic. If it is high, the red cells are macrocytic on average.
That classification is useful, but it is only the beginning. MCV does not tell us the diagnosis. It tells us which direction to look next.
That distinction matters because it is easy to see a low MCV and immediately think “iron deficiency,” or to see a high MCV and jump straight to vitamin B12 or folate deficiency. Sometimes that interpretation is correct. Sometimes it is not. The rest of the CBC still has to make sense.
This is the same habit used in practical CBC interpretation: read related results as a connected pattern, not as isolated values.
Start With the Laboratory Reference Interval
MCV should always be interpreted using the reference interval validated by the laboratory.
For the examples used in HemeLabNotes, I will use:
- Microcytic: MCV < 78 fL
- Normocytic: MCV ≥ 78 fL to < 98 fL
- Macrocytic: MCV ≥ 98 fL
These are HemeLabNotes examples for discussion. They should not replace your laboratory’s own validated reference interval.
Different laboratories may use different analyzers, patient populations, age groups, and locally established intervals. The category should come from the laboratory reference range, not from a number memorized from a textbook.
Low MCV: Microcytosis Is a Pattern
A low MCV means the average red-cell volume is below the laboratory reference interval. It does not automatically mean iron deficiency.
When I see microcytosis, I immediately look at the rest of the red-cell picture:
- Hemoglobin
- RBC count
- RDW
- MCH
- Previous CBC results
- Iron studies, if available
- Clinical context
The relationship between those values is usually more useful than the MCV by itself.
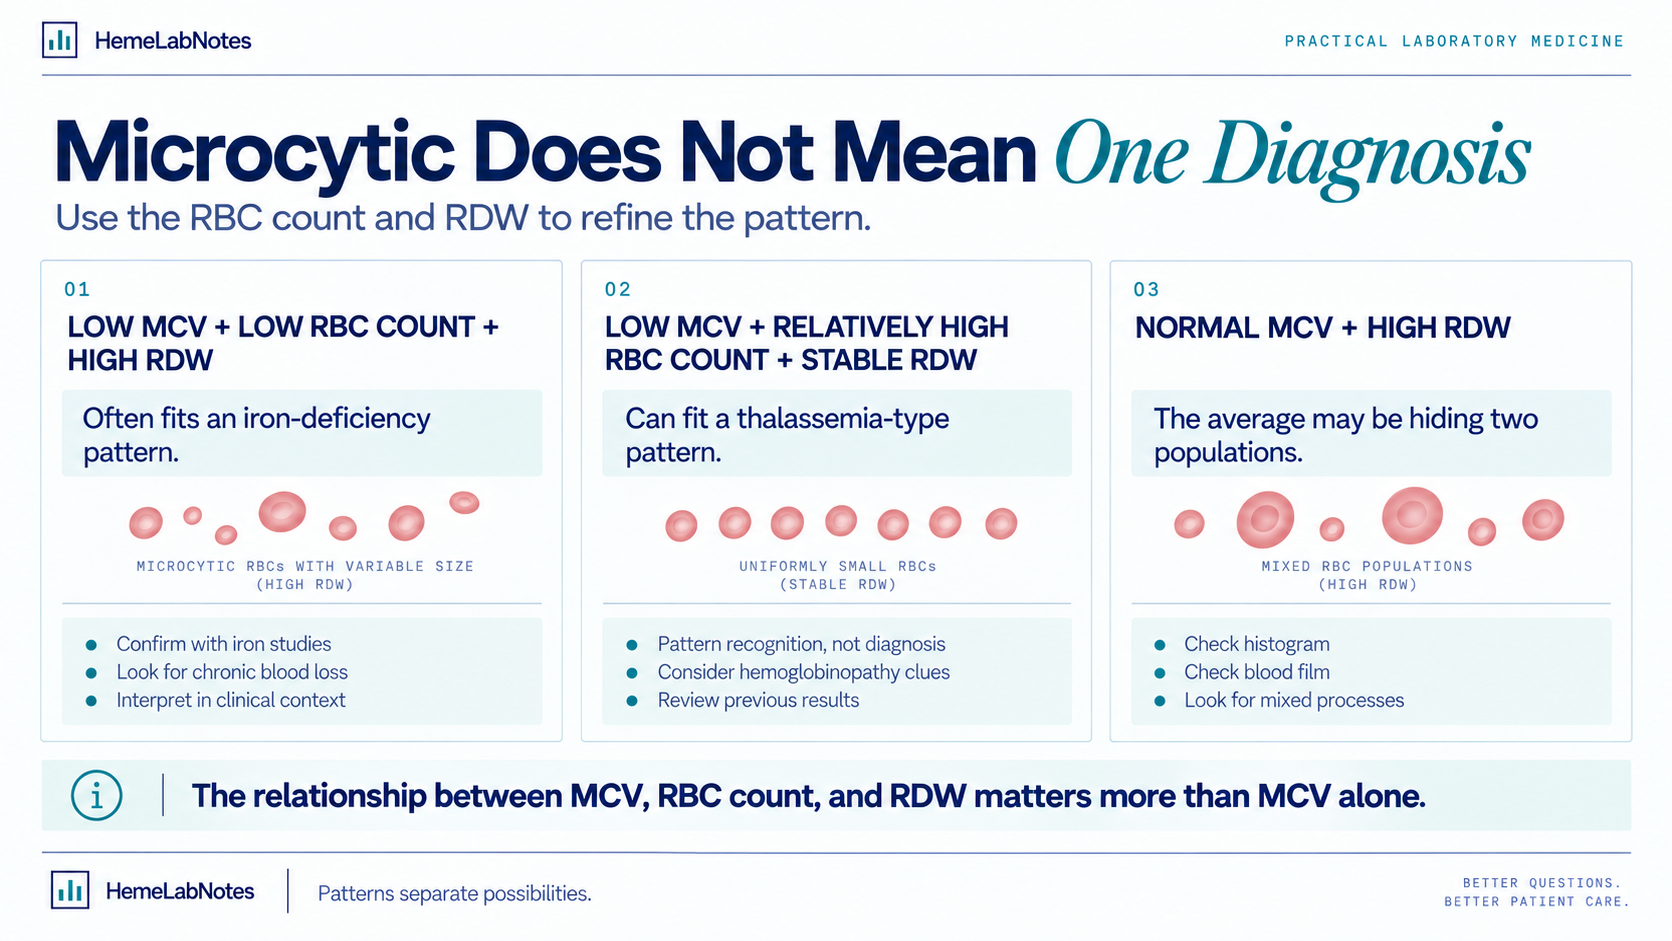
For example, low hemoglobin, low MCV, rising RDW, and a relatively reduced RBC count do not form the same pattern as mildly reduced hemoglobin, a very low MCV, a relatively high RBC count, and a fairly stable RDW.
Both are microcytic. They are not telling the same story.
The RBC Count Helps Refine a Microcytic Pattern
In marked microcytosis, I pay particular attention to the RBC count.
A relatively preserved or elevated RBC count despite a very low MCV can point toward a thalassemia-type pattern. That does not diagnose thalassemia. It simply changes the direction of the investigation.
Iron deficiency often produces a different combination, particularly when the RBC count falls and the RDW begins to widen.
This is why I prefer to think of MCV as a sorting tool. It sorts the red-cell picture into a broad category. The next parameters tell us whether that category behaves as expected.
RDW Can Show What the Average Is Hiding
MCV is an average. That is one of its strengths, but also one of its limitations.
Two very different red-cell populations can produce the same average MCV. RDW helps tell us how variable the red-cell sizes are.
Low MCV + increased RDW may fit an evolving iron-deficiency pattern, where the red-cell population becomes increasingly heterogeneous.
By contrast, low MCV + relatively normal RDW may suggest a more uniform microcytic population.
These are clues. They do not replace ferritin, iron studies, hemoglobin analysis, or clinical evaluation. But they make the CBC more useful.
Microcytosis Has More Than One Cause
Microcytosis can occur in several settings, including iron deficiency, thalassemia-type patterns, chronic inflammatory states, sideroblastic disorders, and selected hemoglobinopathies.
One particularly important cause of iron deficiency is chronic blood loss. Persistent gastrointestinal, gynecologic, or other blood loss can gradually deplete iron stores. As iron deficiency develops, the CBC may move toward a microcytic, hypochromic pattern with a lower MCV, lower MCH, and often a wider RDW.
The CBC can suggest the direction, but it cannot establish the cause. A low MCV should lead to a question, not a conclusion.
Normocytic Does Not Mean Normal
A normal MCV can be falsely reassuring. A patient may have significant anemia while the MCV remains within the reference interval.
“Normocytic” describes the average red-cell volume. It does not mean the red-cell picture is normal.
Normocytic anemia may be seen with acute blood loss, renal disease, chronic inflammatory states, hemolysis, bone marrow disorders, early iron deficiency, and mixed nutritional deficiencies.
Blood Loss Is a Good Example of Why Timing Matters
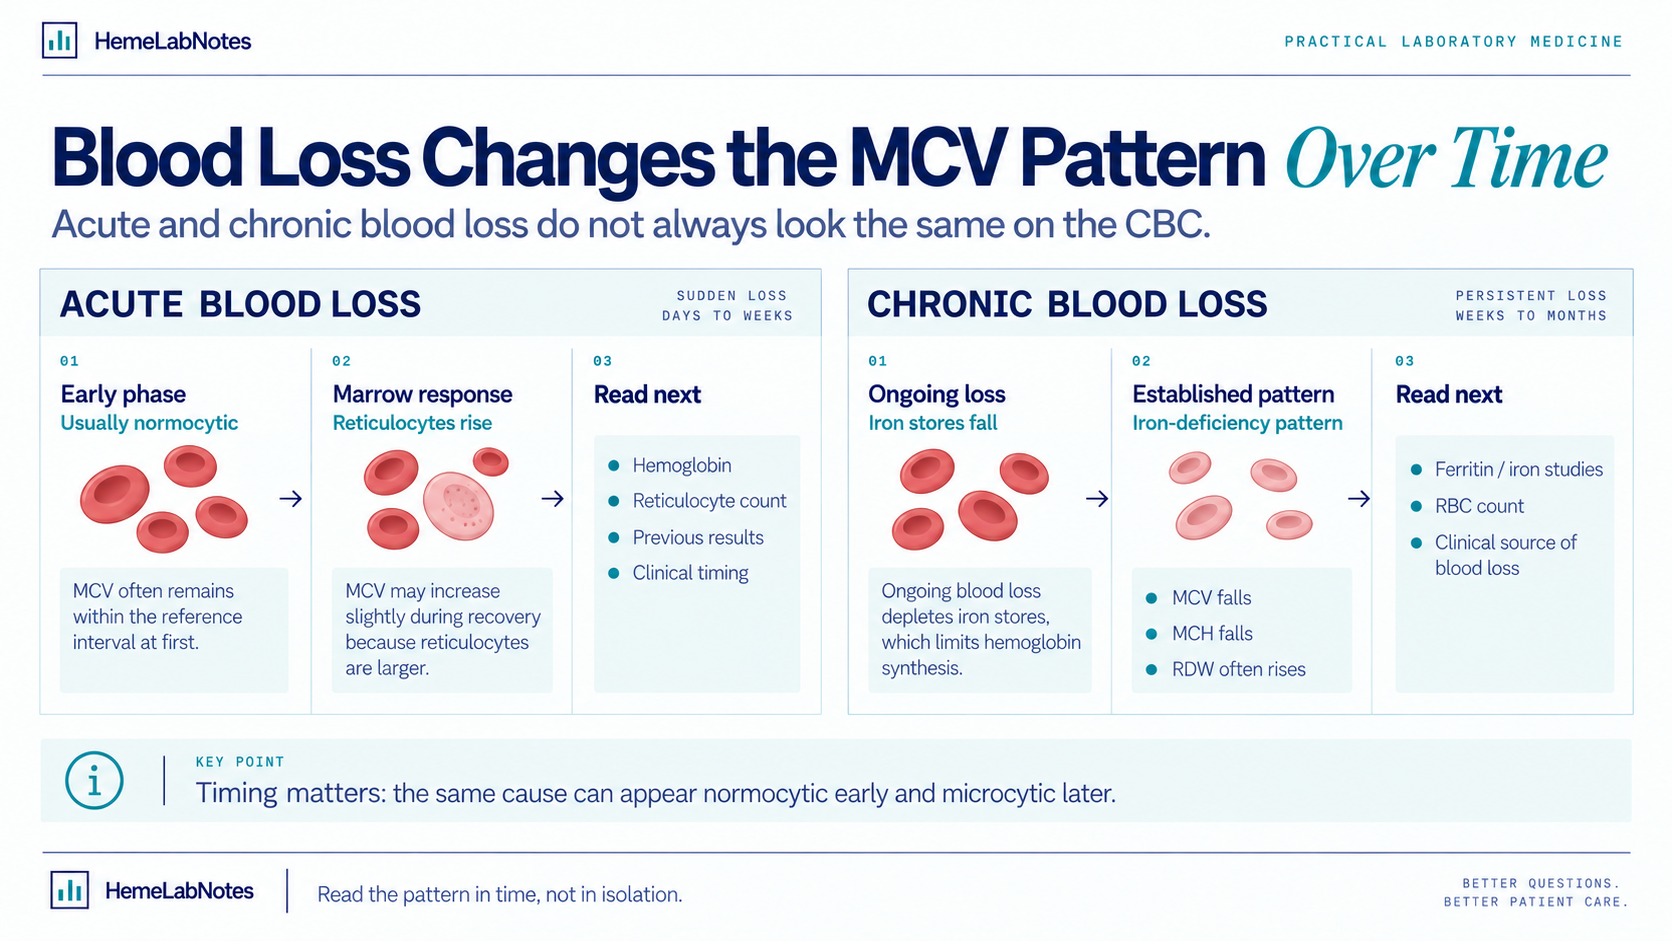
Acute blood loss is usually normocytic initially. The red cells being lost are normal-sized circulating cells, so the MCV may remain within the reference interval in the early phase.
As the marrow responds, reticulocytosis may develop. Because reticulocytes are larger than mature red cells, the MCV may increase slightly during recovery.
Chronic blood loss is different. Persistent blood loss can gradually deplete iron stores and eventually produce an iron-deficiency pattern. At that point, the MCV may fall and the anemia may become microcytic.
The same underlying process—blood loss—can therefore produce a different MCV pattern depending on when the patient is tested.
A Normal MCV Can Hide Two Populations
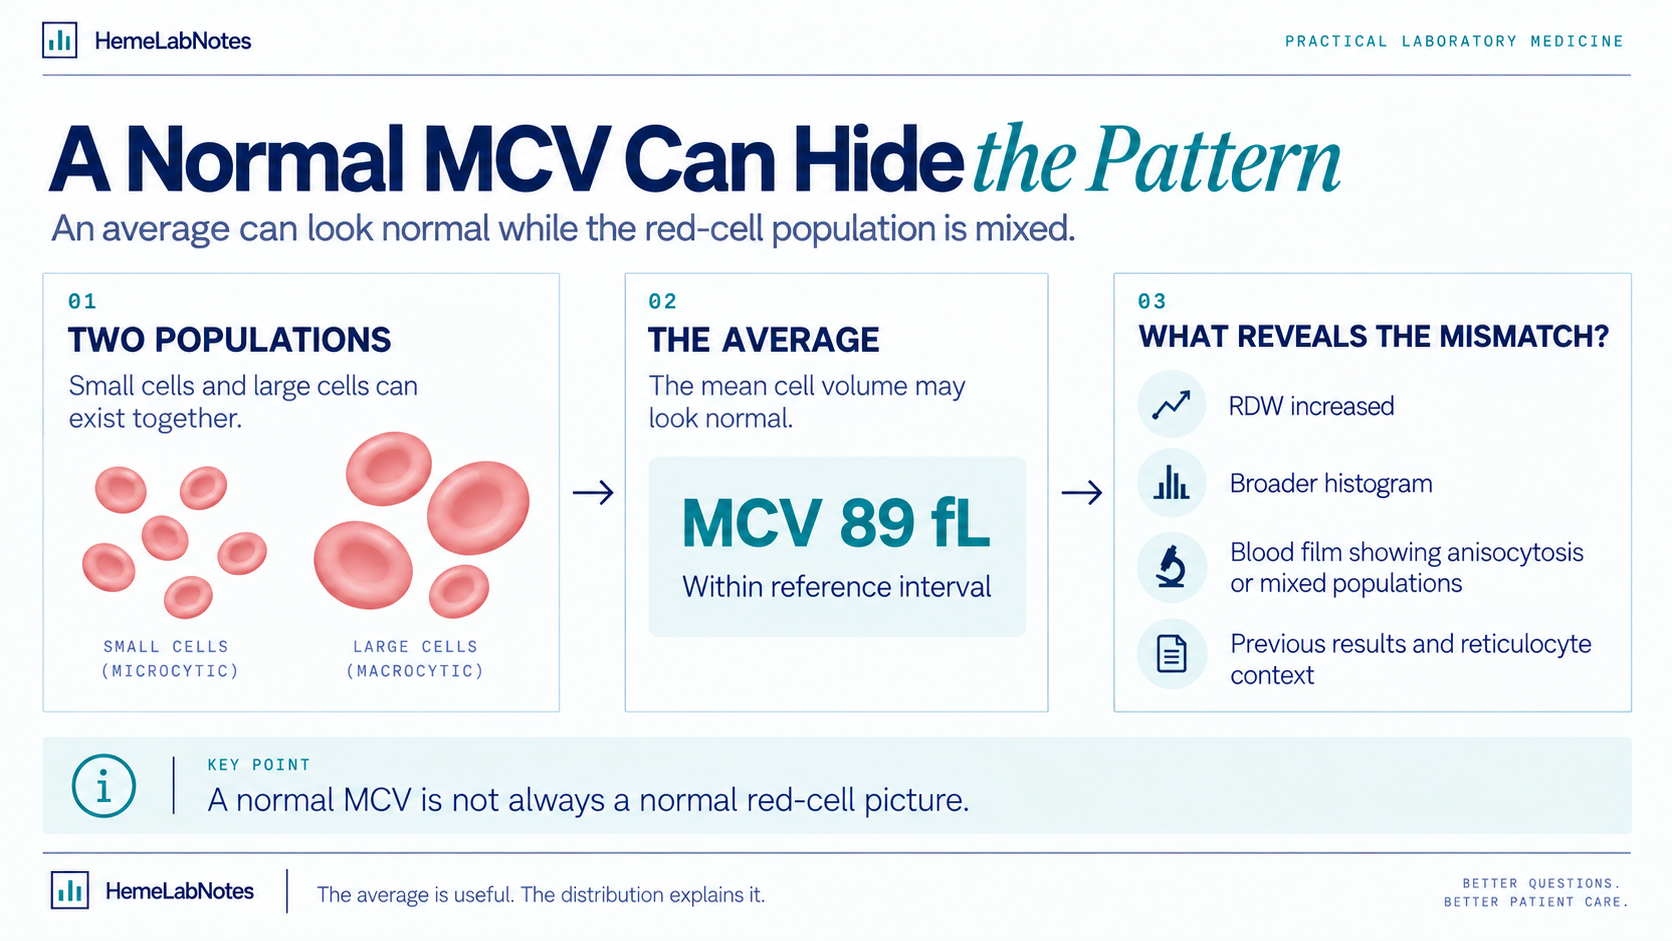
Mixed processes are another reason not to trust the MCV in isolation. One process may push the cell size down while another pushes it up. The average lands somewhere in the middle.
The MCV looks normal. The red-cell population may not be.
Imagine one population of small red cells and another of larger red cells. The average MCV may sit comfortably inside the reference interval, while the RDW is increased, the histogram is broader than expected, or the blood film shows two distinct populations.
The analyzer gives us the average. The distribution tells us what the average may be hiding.
Early Iron Deficiency May Still Be Normocytic
Iron deficiency does not always begin with a low MCV. Early in the process, hemoglobin may begin to fall before the MCV moves below the reference interval.
A normocytic anemia therefore does not exclude developing iron deficiency. If the patient’s MCV has been gradually drifting downward over several months, even while still technically “normal,” that trend may be more informative than the single current value.
MCV direction can matter before MCV classification changes.
High MCV: Look Beyond the Number
When the MCV is elevated, I ask the same basic question: does the rest of the CBC support this?
Macrocytosis may be associated with reticulocytosis, vitamin B12 deficiency, folate deficiency, liver-related changes, alcohol use, medication effects, and bone marrow disorders.
But a sudden jump in MCV also deserves a technical check. If the MCV was stable previously and is now unexpectedly high, I want to know whether something changed in the specimen or analyzer result. A large shift that does not fit the rest of the CBC is a reason to slow down.
Reticulocytes Can Explain a High MCV
Reticulocytes are larger than mature red cells. When reticulocytosis is present, the MCV may rise.
This can be useful when the clinical picture suggests recovery after blood loss or a hemolytic process. After acute blood loss, the initial anemia may be normocytic. Once the marrow responds and releases more reticulocytes, the MCV may move upward.
The point is not that a high MCV means reticulocytosis. The point is that the reticulocyte count may explain why the MCV is high.
Previous Results Matter
MCV is often most useful when compared with the patient’s previous values.
A patient whose MCV has been around 87 fL for years and suddenly appears at 102 fL deserves a different level of attention from someone whose MCV has been stable around 100 fL for a long time.
The absolute value matters. The direction of change matters too.
The same applies in the other direction. An MCV moving gradually from 90 fL to 84 fL to 79 fL may be telling us something before it crosses the laboratory’s lower reference limit.
The Analyzer Can Add More Than the MCV Number
Modern hematology analyzers provide more than the numerical MCV. Depending on the platform, histograms and other graphical information may show whether the red-cell population is broad, mixed, or otherwise unusual.
If the MCV does not fit the hemoglobin, RDW, RBC count, or previous results, the graphics may help explain why. A normal average does not guarantee a uniform population.
When the Blood Film Adds Value
The blood film is especially useful when the automated indices do not form a coherent pattern.
Questions that may justify film review include:
- Is there obvious anisocytosis despite a normal MCV?
- Is there a mixed microcytic and macrocytic population?
- Does the morphology support iron deficiency or another process?
- Are there polychromatic cells suggesting reticulocytosis?
- Are analyzer flags pointing toward something the indices cannot explain?
The film should answer a specific question. It should not be performed simply because one MCV result is outside the reference interval.
MCV Should Lead to the Next Question
That is the value of MCV. It narrows the field. It does not finish the interpretation.
A Bench Example
Consider this CBC:
- Hemoglobin: 9.8 g/dL
- MCV: 74 fL
- MCH: low
- RDW: increased
- RBC count: reduced
That pattern makes me think differently from:
- Hemoglobin: 11.2 g/dL
- MCV: 64 fL
- MCH: low
- RDW: relatively stable
- RBC count: elevated
Both are microcytic. The MCV puts them in the same broad category. The rest of the CBC separates them.
Now consider another patient:
- Hemoglobin: 9.5 g/dL
- MCV: 89 fL
- RDW: increased
- Reticulocytes: increased
A normal MCV does not make this anemia uninteresting. The reticulocyte response, RDW, previous hemoglobin, and clinical history may tell us much more than the MCV category itself.
The Habit That Matters Most
Whenever an MCV catches my attention, I try not to stop at the label. I look for the two or three results that should move with it.
If they fit, the pattern becomes clearer. If they do not, that mismatch is often where the useful question begins.
Microcytic. Normocytic. Macrocytic. Those labels are convenient. The interpretation lives in the relationship between the numbers.
Final Thoughts
MCV is useful because it gives direction quickly, but it becomes much more useful when it is treated as part of a pattern.
A low MCV is not automatically iron deficiency. A normal MCV is not automatically reassuring. A high MCV is not automatically a vitamin deficiency.
Acute blood loss may initially be normocytic. Chronic blood loss may eventually become microcytic as iron stores are depleted. Reticulocytosis may push the MCV upward during marrow recovery.
The better question is:
What does the MCV tell me to look at next?
That is where interpretation begins.
Educational note: This article is intended for laboratory education and professional discussion. Reference intervals, review criteria, and follow-up procedures vary by laboratory and patient population. Always follow your laboratory’s validated procedures and relevant clinical guidance.