RDW is one of those CBC parameters that is easy to ignore.
It is also easy to overinterpret.
A high RDW tells us that the red cells vary more in size than expected. That can be useful, especially when the MCV alone is hiding a mixed population.
But RDW does not tell us why the cells are different sizes.
That distinction matters.
When I see an abnormal RDW, I do not ask:
What diagnosis causes this RDW?
I ask:
What is the RDW adding to the rest of the red-cell pattern?
That is where it becomes useful. It is the same bench habit used in practical CBC interpretation: read related parameters together, then investigate the mismatch.
What RDW Actually Tells Us
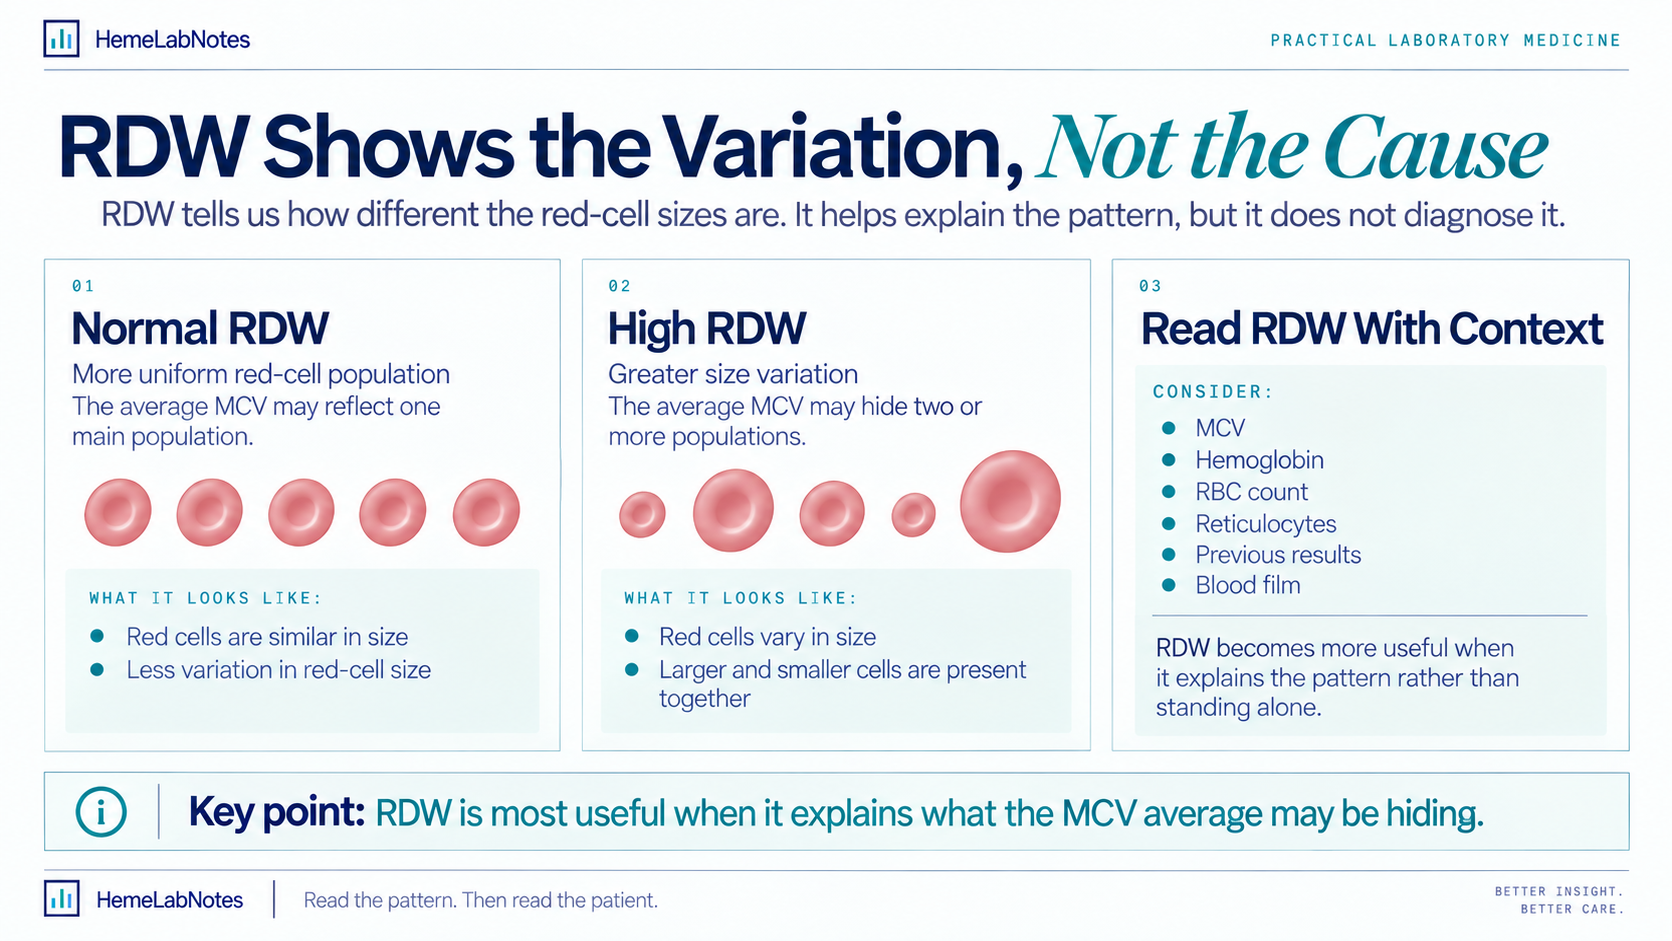
RDW stands for red cell distribution width. In practical terms, it describes how much variation there is in red-cell size.
A population of red cells that are fairly similar in size tends to have a lower or normal RDW. A population containing noticeably smaller and larger cells tends to have a higher RDW.
This variation in cell size is called anisocytosis.
The important point is that RDW describes the distribution. It does not identify the cause of that distribution.
A high RDW can appear in very different clinical situations. That is why I rarely interpret it alone.
Start With MCV Beside It
I find RDW most useful when MCV is sitting next to it.
MCV tells us the average red-cell volume. RDW tells us how much individual cells differ around that average.
Those are different questions.
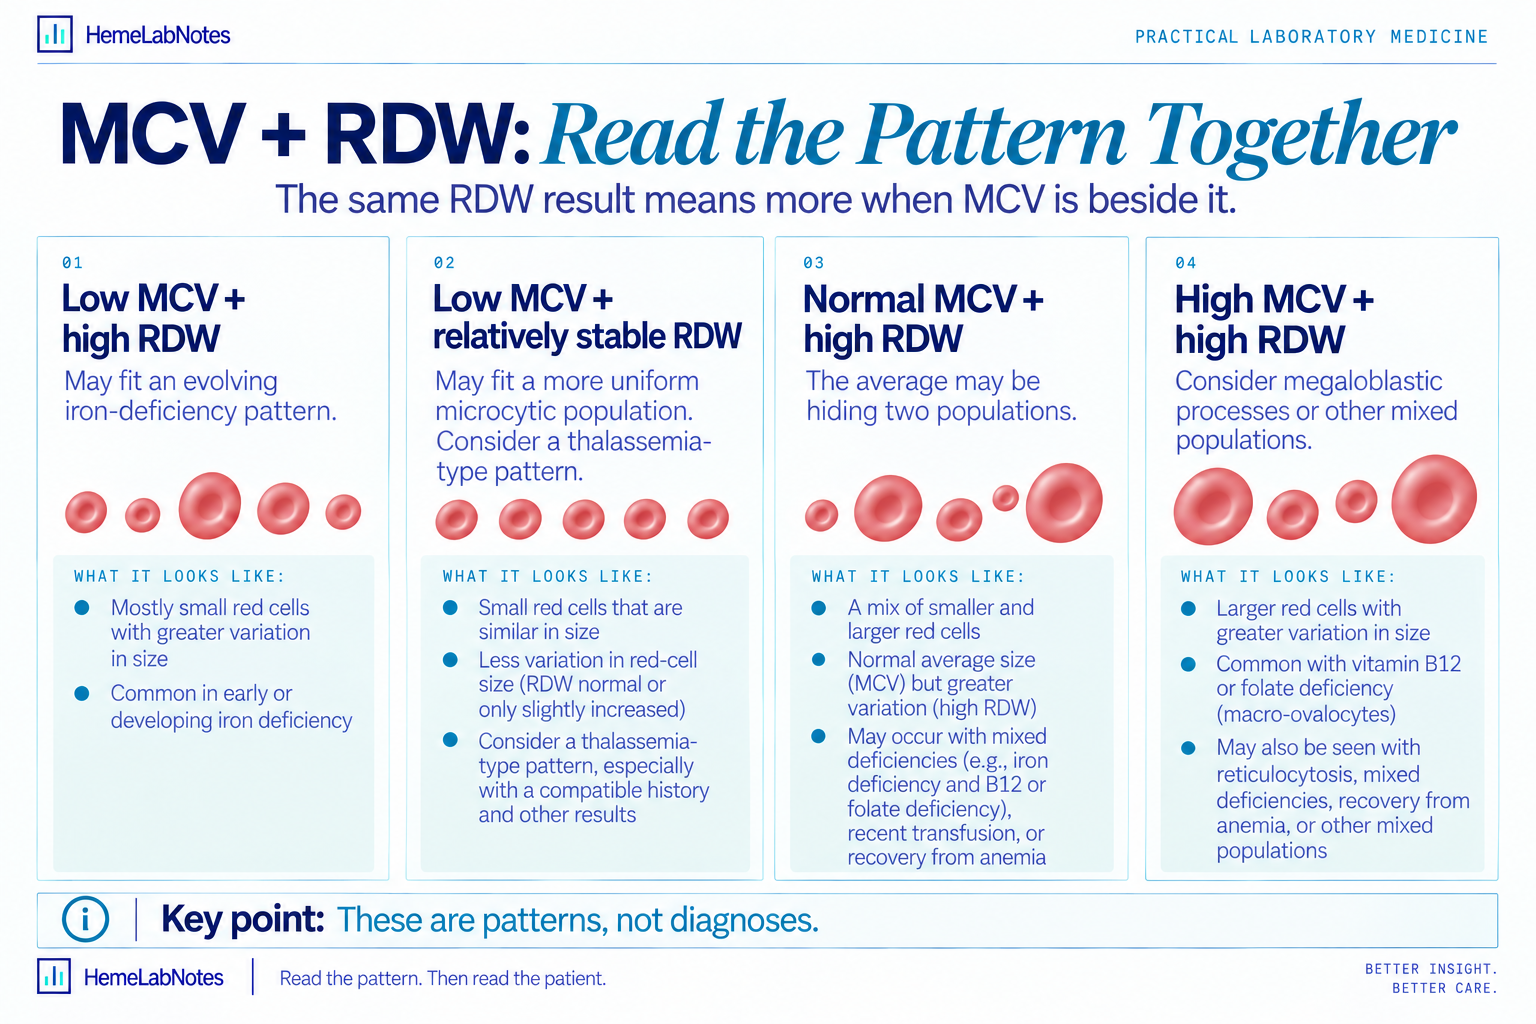
For example, two patients may both have an MCV of 72 fL. One has a normal or relatively stable RDW. The other has a markedly increased RDW.
Both are microcytic. But the red-cell populations are not behaving the same way.
That difference may help decide what deserves attention next. A fuller guide to MCV interpretation develops this relationship in more detail.
For examples on HemeLabNotes, the MCV ranges are:
- Microcytic: MCV < 78 fL
- Normocytic: MCV ≥ 78 fL to < 98 fL
- Macrocytic: MCV ≥ 98 fL
These are HemeLabNotes example ranges, not universal cutoffs. Laboratories should use their own validated reference intervals.
Low MCV + High RDW
A low MCV with an increased RDW commonly fits an evolving iron-deficiency pattern.
As iron availability worsens, newly produced red cells may become progressively smaller. Older cells already in circulation may still be closer to their previous size. The result is a population containing cells of different sizes, and the RDW rises.
This becomes especially useful when the rest of the pattern also fits:
- Hemoglobin falling
- MCV decreasing
- MCH decreasing
- RBC count not disproportionately elevated
- Previous indices showing a downward trend
That pattern supports a direction. It still does not establish iron deficiency by itself.
Ferritin, iron studies, the clinical history, and the possible source of iron loss still matter.
Low MCV + Relatively Stable RDW
Now consider another microcytic CBC.
The MCV is markedly low, but the RDW is relatively stable and the RBC count is preserved or increased.
That looks different.
A more uniform population of small cells can fit a thalassemia-type pattern better than an evolving iron-deficiency pattern.
Again, that is pattern recognition, not diagnosis.
A normal RDW does not rule out iron deficiency. A high RDW does not rule out thalassemia. And some patients can have more than one process at the same time.
RDW Can Reveal What a Normal MCV Is Hiding
One of the most useful situations for RDW is when the MCV looks normal.
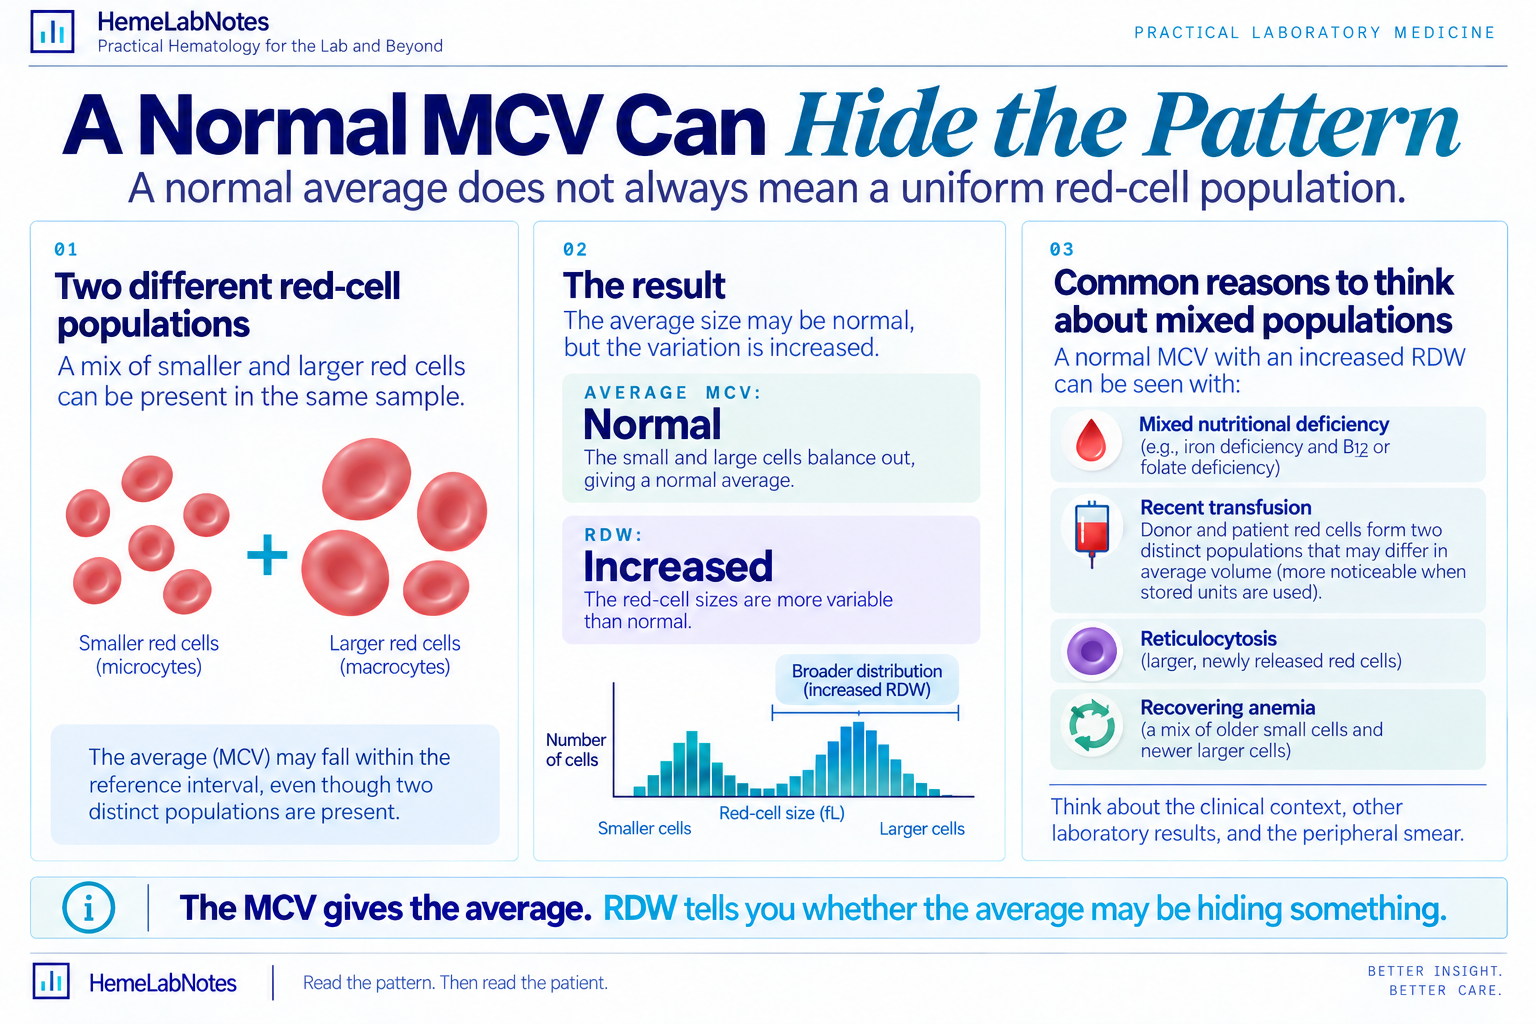
Remember that MCV is an average. A patient can have small cells and large cells circulating at the same time, and the average may land right in the middle.
For example, some cells might be around 70 fL while others are around 105 fL. The calculated average could still fall within the laboratory reference interval.
If we looked only at the MCV, the red-cell population might appear unremarkable. But the RDW may be clearly increased.
That is a clue that the average is hiding something.
Situations where this can happen include mixed nutritional deficiencies, transfusion, reticulocytosis, recovery from anemia, or other mixed red-cell populations.
This is where the analyzer histogram or blood film can become more useful than the average alone.
A Normal MCV Is Not Always a Normal Population
This is worth emphasizing because it is a common trap.
Suppose the CBC shows:
- Hemoglobin: low
- MCV: 89 fL
- RDW: high
It would be easy to label that as “normocytic anemia” and stop. But the elevated RDW is telling us that the cells are not particularly uniform.
I would want to know:
- Has the RDW changed from previous results?
- Is the histogram broad or bimodal?
- Are reticulocytes increased?
- Has the patient recently been transfused?
- Could there be both microcytic and macrocytic processes?
- What does the blood film show if review is indicated?
The normal MCV gives the average. The RDW tells us whether that average deserves to be trusted as a description of the whole population.
High MCV + High RDW
When both MCV and RDW are increased, I still read the combination as a pattern rather than a diagnosis.
Megaloblastic processes, including vitamin B12 or folate deficiency, may produce a larger and more variable red-cell population. Reticulocytosis can also increase both values because reticulocytes are larger than mature red cells.
Mixed deficiencies, recovery from anemia, and other mixed red-cell populations can create the same broad direction.
The useful next step is to ask what related results explain the pattern: hemoglobin, reticulocytes, previous indices, relevant nutritional testing, the histogram, and the blood film when indicated.
Recent Transfusion Can Increase RDW
Transfusion is a good example of why context matters.
Donor and patient red cells form two distinct populations that may differ in average volume.
That can widen the red-cell distribution. The MCV after transfusion may still look fairly ordinary, while the RDW increases because two populations are now present.
This does not mean the patient suddenly developed a new red-cell disorder. It means the circulating population changed.
Whenever an RDW changes significantly, recent transfusion history is worth knowing.
Reticulocytosis Can Widen the Distribution
Reticulocytes are larger than mature red cells.
If the marrow responds strongly after blood loss or hemolysis, more reticulocytes enter circulation. That can increase variation in cell size and may raise the RDW. It may also shift the MCV upward.
So a high RDW in a recovering anemia does not necessarily mean the underlying process is worsening. Sometimes it reflects marrow response.
Again, timing matters.
RDW During Iron-Deficiency Treatment
RDW can also behave interestingly after treatment begins.
Imagine a patient with established iron deficiency. Many circulating cells are already microcytic. Once iron treatment starts and erythropoiesis improves, newer red cells may become larger and closer to normal size.
For a while, the circulation may contain older microcytic cells and newer, better hemoglobinized cells. The variation can actually become more obvious before the population eventually becomes more uniform.
So RDW should not be interpreted as a simple “higher means worse.” It is describing the mixture of cells at that point in time.
High RDW Does Not Have One Diagnosis
A high RDW may be seen in many situations, including:
- Iron deficiency
- Vitamin B12 or folate deficiency
- Mixed nutritional deficiencies
- Reticulocytosis
- Recent transfusion
- Recovery after blood loss
- Hemolytic processes
- Mixed red-cell populations
- Some marrow disorders
That list is exactly why RDW should not be used as a diagnosis.
The same RDW result can appear for very different reasons. What matters is what the rest of the CBC is doing.
What About a Low RDW?
A low RDW usually has much less interpretive value. It generally means the red-cell population is fairly uniform in size, and that may be perfectly normal.
Unlike a high RDW, a low RDW is usually not something I would chase by itself. If the hemoglobin, MCV, RBC count, and other parameters make sense, a slightly low RDW is rarely the most interesting finding on the report.
Not every number outside the reference interval deserves the same amount of attention.
RDW-CV and RDW-SD Are Not the Same
Depending on the hematology analyzer, the CBC may report RDW-CV, RDW-SD, or both.
They describe red-cell size variation in different ways.
RDW-CV is expressed as a percentage and is calculated from the relationship between the standard deviation of red-cell volume and the MCV:
RDW-CV (%) = SD of red-cell volume ÷ MCV × 100
Because MCV is part of the calculation, RDW-CV is influenced by the average red-cell size. When the MCV is very low, the RDW-CV may appear proportionally higher even if the absolute spread in red-cell size has not increased to the same degree.
RDW-SD, by contrast, is expressed in femtoliters and reflects the actual width of the red-cell volume distribution at a defined level of the histogram.
Some analyzer systems measure this width at approximately 20% of the histogram peak height, but the exact method is analyzer-specific.
RDW-CV and RDW-SD are related, but they are not interchangeable. Their reference intervals and analytical behavior depend on the hematology system used by the laboratory.
For practical review, use the parameter, method, and reference interval validated by the local laboratory.
Previous Results Make RDW More Useful
As with MCV, I find RDW much more useful when I can compare it with previous CBCs.
For example:
CBC 1
- Hb 13.8 g/dL
- MCV 87 fL
- RDW normal
Several Months Later
- Hb 11.9 g/dL
- MCV 82 fL
- RDW increased
Later Still
- Hb 10.2 g/dL
- MCV 76 fL
- RDW clearly increased
The final CBC is microcytic. But the trend started before the MCV crossed the lower reference limit.
The increasing RDW and falling MCV together tell a much better story than either result alone. The direction of change matters.
RDW and the Red-Cell Histogram
When the numbers do not quite fit, I like to look at the histogram.
A narrow population generally produces a narrower distribution. A mixed population may broaden the histogram or sometimes produce a more obviously complex shape.
The histogram can help answer questions such as:
- Is the red-cell population genuinely broad?
- Could two populations be present?
- Does the MCV represent one population reasonably well?
- Is there something about the distribution that the average is hiding?
The RDW gives us a number. The histogram lets us see the distribution behind that number.
The Blood Film Can Explain the RDW
When indicated, the peripheral blood film can make an abnormal RDW much easier to understand.
A high RDW may correspond with obvious anisocytosis. But the film can also show what type of variation is present.
Are there predominantly microcytic cells, macro-ovalocytes, polychromatic cells, two distinct red-cell populations, or marked anisopoikilocytosis?
RDW tells us that size variation exists. Morphology tells us more about what that variation looks like.
That is why the two pieces of information are complementary.
Do Not Diagnose Iron Deficiency or Thalassemia From RDW Alone
A high RDW can support an iron-deficiency pattern. It cannot diagnose iron deficiency.
Likewise, a normal RDW does not exclude it. A relatively stable RDW beside marked microcytosis may support a thalassemia-type direction, but it cannot diagnose thalassemia either.
If either possibility is clinically relevant, the appropriate laboratory investigation and patient history remain important.
The CBC helps us recognize a pattern and decide what question to ask next. It does not replace confirmatory investigation.
A Practical Way to Read RDW
When RDW catches my attention, I usually work through it like this:
- Look at the MCV. Is the pattern microcytic, normocytic, or macrocytic by the local reference interval?
- Look at the RBC count. Does it fit the pattern, particularly when the MCV is low?
- Look at hemoglobin. How significant is the anemia, and has it changed?
- Compare previous results. Is the RDW newly increased, gradually rising, or chronically stable?
- Ask what could create two populations. Consider evolving deficiency, treatment response, reticulocytosis, transfusion, or mixed deficiencies.
- Use the analyzer and film when needed. If the pattern still does not make sense, the histogram and blood film may answer the question.
A Bench Example
Consider:
- Hemoglobin: 9.4 g/dL
- MCV: 70 fL
- MCH: low
- RDW: 19%
- RBC count: 3.9 × 10¹²/L
The low MCV tells us the cells are microcytic on average. The high RDW tells us the cells are not uniformly microcytic. The lower RBC count adds another piece.
Together, that pattern may fit an evolving iron-deficiency picture better than a uniform thalassemia-type pattern.
But that is still not the diagnosis. The next step is to correlate with iron studies and clinical context.
Now compare:
- Hemoglobin: 11.0 g/dL
- MCV: 64 fL
- MCH: low
- RDW: relatively stable
- RBC count: 5.8 × 10¹²/L
Still microcytic. Very different pattern.
That is where RDW earns its place.
Another Bench Example: Normal MCV, High RDW
Now consider:
- Hemoglobin: 9.8 g/dL
- MCV: 88 fL
- RDW: markedly increased
The MCV is normal. But the CBC is not giving me a normal red-cell picture.
I would want to know whether the patient has a mixed nutritional deficiency, recent transfusion, reticulocytosis, a changing anemia, or two red-cell populations.
This is exactly where RDW can stop a normal MCV from giving false reassurance.
When RDW Does Not Add Much
RDW is less useful when it simply confirms what is already obvious and does not change the next step.
For example, if a patient has a well-established, stable pattern that has already been investigated, a small RDW change may not materially alter interpretation.
Likewise, chasing an isolated RDW abnormality while ignoring hemoglobin, MCV, RBC count, history, and previous results usually adds more noise than value.
RDW earns its place when it explains something. It is less useful when it becomes the thing being explained.
The Habit That Matters
Whenever RDW is high, I try to avoid reading it as “abnormal RDW equals disease.”
Instead I ask:
What variation is this RDW revealing, and does that help explain the CBC?
Sometimes it supports a microcytic pattern. Sometimes it reveals a mixed population. Sometimes it reflects reticulocytosis or recent transfusion. Sometimes it simply confirms what the histogram or blood film already shows.
The number matters. The context matters more.
Final Thoughts
RDW tells us how much red-cell size varies. It does not tell us why.
A high RDW can support an evolving iron-deficiency pattern. It can reveal mixed populations when the MCV looks normal. It can rise with reticulocytosis. It can change after transfusion or treatment. And sometimes it adds very little unless the rest of the CBC gives it meaning.
The useful question is not “Is the RDW high?”
It is:
What is the RDW helping me understand about this red-cell population?
That is when RDW becomes worth paying attention to.
Educational note: This article is intended for laboratory education and professional discussion. RDW methodology varies between analyzers, reference intervals vary by laboratory and population, and the HemeLabNotes MCV example cutoffs are not universal. Local validated laboratory procedures take precedence, and interpretation should be correlated with the clinical and laboratory context.
References
- Bain BJ, Bates I, Laffan MA. Dacie and Lewis Practical Haematology. 12th ed. Elsevier; 2017.
- Bain BJ, Leach M. Blood Cells: A Practical Guide. 7th ed. Wiley; 2025.
- Keohane EM, Preston MM, Mirza KM, Walenga JM, eds. Rodak’s Hematology: Clinical Principles and Applications. 7th ed. Elsevier; 2024.
- Merck Manual Professional Edition. Evaluation of Anemia.
- Spadaro S, Taccone FS, Fogagnolo A, et al. The effects of blood transfusion on red blood cell distribution width in critically ill patients: a pilot study. Transfusion. 2018;58(8):1863–1869. doi:10.1111/trf.14759.
- ARUP Consult. Microcytic Anemia Testing Algorithm. Updated February 2024.