Sometimes the analyzer gives you an answer that looks obvious.
There is an HbE-containing fraction.
HbA is present.
The patient is not very anemic.
It is tempting to stop there and call it HbE trait.
Often that will be correct.
But HbE is one of those findings where the percentage, the CBC, the other hemoglobin fractions, and the analytical platform all matter.
HbE can occur alone.
It can coexist with α-thalassemia.
It can coexist with iron deficiency.
And it can be inherited together with β-thalassemia, producing a pattern that ranges from relatively mild to clinically severe.
So when HbE appears on a hemoglobin analysis, my first question is not simply:
“Is this HbE?”
It is:
“Does the rest of the laboratory pattern fit simple HbE trait?”
Start With the CBC, Not the HbE Peak
The abnormal fraction may catch the eye first.
But I still start with the CBC.
I want to know whether the hemoglobin is normal, mildly reduced, or substantially reduced; how low the MCV and MCH are; whether the RBC count is preserved; whether RDW is relatively stable or clearly increased; whether the pattern is longstanding; and whether iron deficiency explains part of the microcytosis.
Simple heterozygous HbE is generally a mild phenotype.
Classic descriptions place HbE at approximately 25–30% of total hemoglobin in uncomplicated HbE trait. [1,2]
But that number should not become a universal diagnostic box.
Iron deficiency can alter the red-cell indices.
α-thalassemia can modify the HbE fraction.
β-thalassemia can completely change the pattern.
And different analytical systems do not necessarily quantify HbE in exactly the same way.
The HbE fraction matters.
The CBC tells me whether that fraction makes sense.
Why HbE Behaves a Little Like a Thalassemia Allele
HbE is a structural β-globin variant.
But it is not only a structural variant.
The codon 26 β-globin mutation activates a cryptic splice site, reducing the amount of normally processed βE-globin messenger RNA.
So the HbE allele produces less βE globin than a normal β-globin allele would produce.
That gives HbE a mild β⁺-thalassemia-like quantitative effect in addition to creating an abnormal hemoglobin molecule. [1]
This becomes particularly important when HbE is inherited with another globin defect.
Simple HbE trait is usually mild.
HbE together with β-thalassemia is a different biological problem.
HbE is both a hemoglobin variant and a quantitatively underproduced β-globin product.
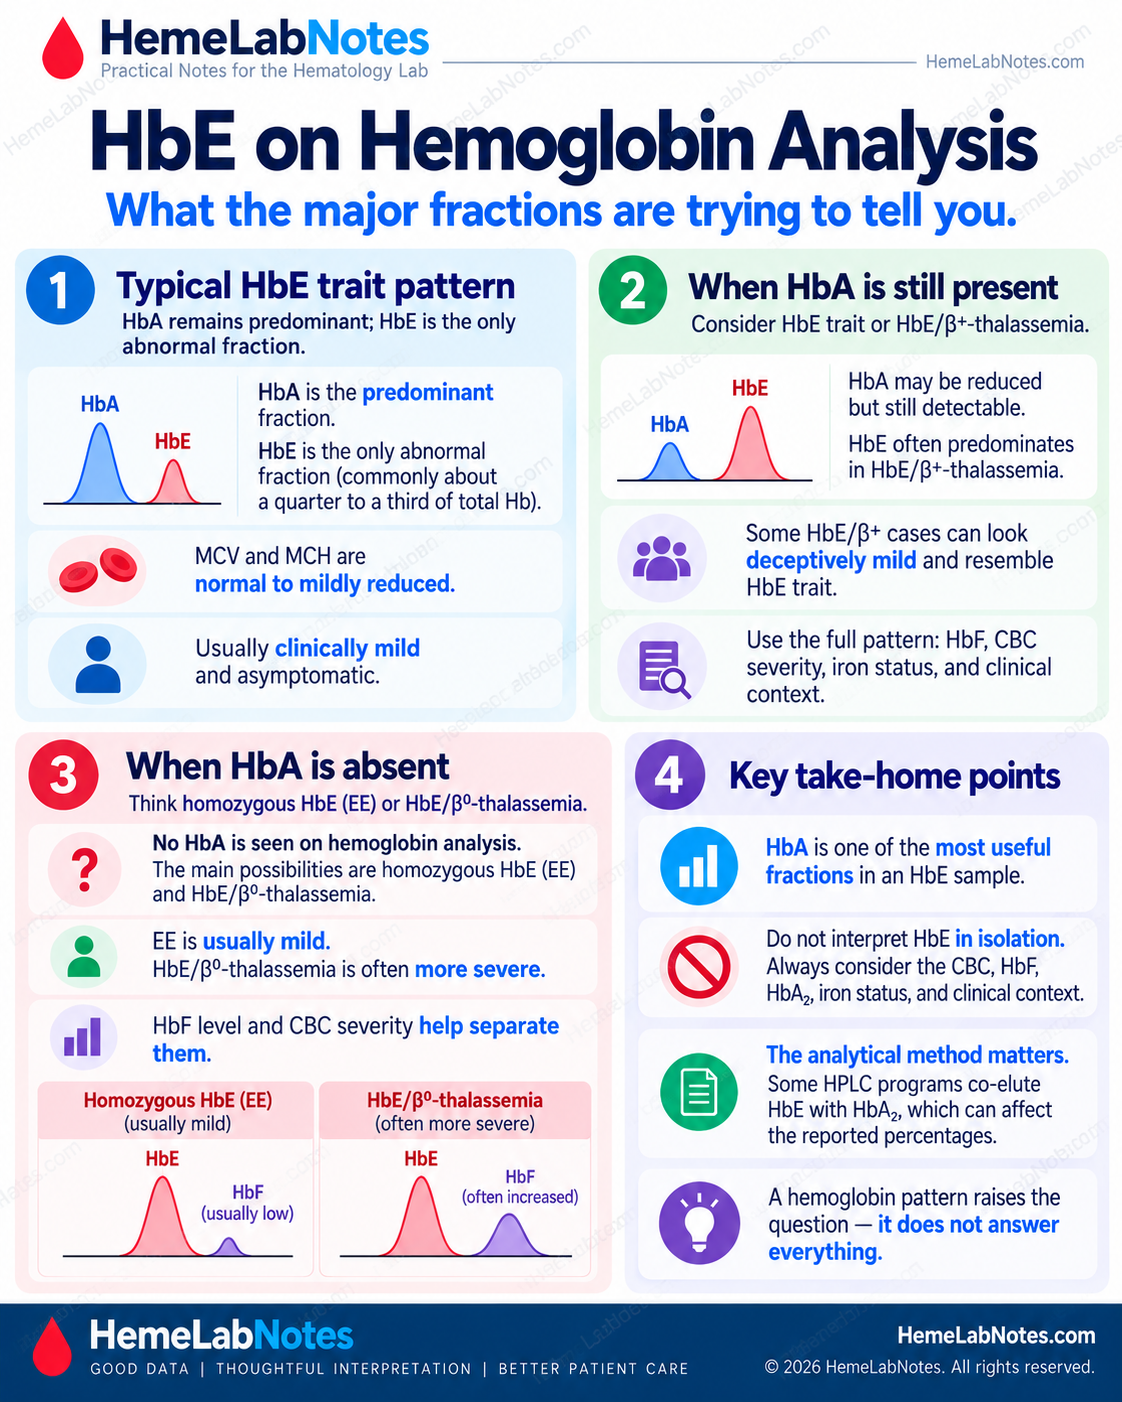
What Simple HbE Trait Usually Looks Like
In uncomplicated heterozygous HbE, I expect the laboratory picture to be relatively quiet.
HbA usually remains predominant. An HbE-containing fraction is present, commonly around 25–30%. HbF is usually low. Hemoglobin is generally normal or only mildly reduced. MCV and MCH may be normal or mildly reduced, and the patient is usually clinically well. [1,2]
This is a pattern.
It is not a definition based on one percentage.
If HbA is clearly predominant, HbF is low, anemia is minimal, and the CBC does not look disproportionately abnormal, simple HbE trait is a reasonable interpretation.
If the CBC looks much more severe than that, I keep looking.
Do Not Diagnose the Genotype From the HbE Percentage Alone
HbE percentage is useful.
But it is not a genotype assay.
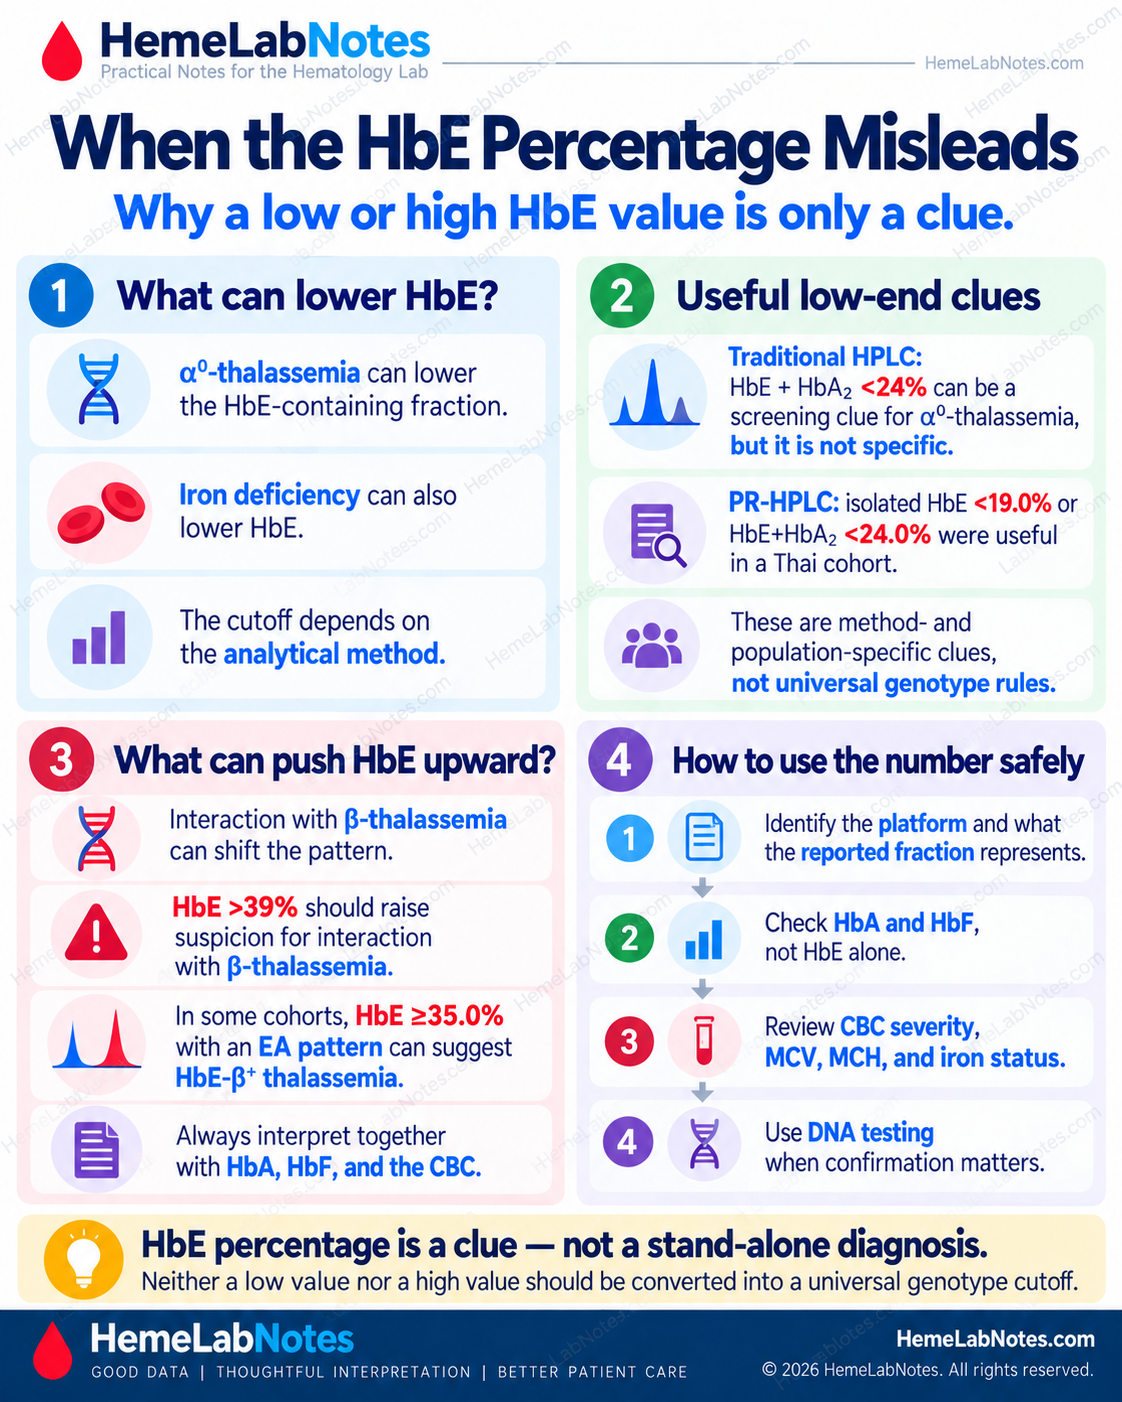
A low HbE fraction may occur with α-thalassemia.
Iron deficiency can also lower HbE and push MCV and MCH further down.
At the other end, an unusually high HbE fraction can raise suspicion of interaction with β-thalassemia.
And the reported percentage depends partly on how the analyzer separates HbE from other fractions.
So I would not use rules such as:
HbE 23% = α-thalassemia
or:
HbE 28% = definitely simple HbE trait
The percentage changes the question.
It does not establish the genotype.
Alpha-Thalassemia Can Change the HbE Fraction
The effect depends on the α-globin genotype.
In uncomplicated HbE trait, HbE commonly accounts for approximately 25–30% of total hemoglobin. [1,2]
Coinherited heterozygous α⁺-thalassemia may produce essentially the same HbE range. The Thalassaemia International Federation describes simple HbE trait and HbE trait with heterozygous α⁺-thalassemia within roughly the same 25–30% range, making them difficult to distinguish by routine hematological screening alone. [2]
So:
HbE around 25–30% does not exclude α-thalassemia.
This needs one qualification.
Homozygous α⁺-thalassemia (-α/-α) can lower HbE, as can iron deficiency, and either may create a false-positive low-HbE screening pattern when looking for α⁰-thalassemia. [9]
Alpha-Zero Thalassemia Behaves Differently
Coinherited α⁰-thalassemia tends to reduce the HbE fraction more noticeably.
Pornprasert and colleagues studied 183 HbE heterozygotes with α⁰-thalassemia and 1,437 without α⁰-thalassemia. On the HPLC system used in that study, HbE and HbA₂ were represented as a combined HbE-containing fraction. A value below 24% identified all 183 α⁰-thalassemia cases, giving 100% sensitivity and 87.2% specificity. However, 12.8% of subjects without α⁰-thalassemia also fell below that threshold. [5]
So a low HbE-containing fraction was a useful screening clue, but it was not specific enough to establish the genotype.
A later study in a Thai cohort using Premier Resolution high-resolution HPLC helps explain the measurement issue more clearly. On that system, the investigators evaluated HbE separately from HbA₂ as well as the combined HbE+HbA₂ value. [9]
For HbE alone, a cutoff below 19.0% gave 100% sensitivity and 91.9% specificity for α⁰-thalassemia.
For HbE+HbA₂ combined, a cutoff below 24.0% gave 100% sensitivity and 89.7% specificity. [9]
Those two numbers are not competing thresholds.
They represent different measurements: HbE alone versus the combined HbE+HbA₂ fraction.
The same study also showed that the older <25% screening threshold had lower specificity: 85.6% with PR-HPLC and 82.5% with capillary electrophoresis. [9]
Even a strong screening test can have modest positive predictive value when the underlying prevalence is low. For the <19.0% threshold, the reported PPV was 70.7% at a 13.4% prevalence of α⁰-thalassemia and only 45.1% at a 5% prevalence. [9]
That is why a low HbE result should trigger the next question, not end the investigation.
An Unusually High HbE Fraction Also Matters
The low end of the HbE distribution is not the only part worth noticing.
An unusually high HbE fraction can also suggest that simple HbE trait may not be the whole story.
TIF guidance notes that an HbE value above approximately 39% should raise suspicion of interaction with β-thalassemia. [2]
More recently, Jomoui and colleagues studied 2,133 individuals with HbE and HbA, including 79 genetically confirmed HbE/β⁺-thalassemia cases. In that Thai cohort, an HbE value of ≥35.0% separated HbE/β⁺-thalassemia from HbE heterozygosity with 100% sensitivity and specificity. [7]
That is an impressive screening result.
But I would not turn 35% into a universal diagnostic cutoff.
It belongs to that population, analytical setting, and case mix.
The practical message is simpler:
An HbE fraction that is clearly higher than expected for uncomplicated trait deserves further investigation, particularly when HbA is present and the CBC also looks thalassemia-like.
Iron Deficiency Can Make the Pattern Look More Abnormal
HbE and iron deficiency can coexist.
That matters because both can push the red-cell indices downward.
An HbE carrier who becomes iron deficient may develop lower hemoglobin, lower MCV, lower MCH, increased RDW, and a lower HbE fraction than expected.
Thalassemia screening guidance specifically notes that iron-deficient HbE heterozygotes may show reduced HbE together with lower MCV and MCH. [2]
So a markedly microcytic HbE-containing sample does not automatically mean HbE/β-thalassemia.
Iron status still matters.
If previous CBCs show mild stable microcytosis and the patient suddenly develops worsening anemia, rising RDW, and low ferritin, iron deficiency may explain the new change.
A genetic trait should be relatively stable.
A changing CBC makes me ask what changed.
HbA Is One of the Most Useful Fractions to Look At
When HbE appears, I pay close attention to HbA.
HbA tells me whether normal βA-globin production is still occurring.
In simple HbE trait, HbA is present and usually remains predominant.
When HbA is absent, the differential changes considerably.
But absence of HbA does not automatically mean HbE/β⁰-thalassemia.
There is another important possibility: homozygous HbE.
HbE/Beta-Zero Thalassemia
A β⁰ allele produces no βA globin.
If HbE is inherited with a β⁰-thalassemia allele, HbA is therefore absent.
The major fractions are HbE and HbF.
HbE may account for approximately 30–70%, with much of the remainder being HbF. [1]
The CBC and clinical phenotype may show substantial anemia and marked microcytosis.
Homozygous HbE
Homozygous HbE also has no HbA.
But the phenotype is usually much milder.
Classic TIF descriptions show approximately 85–95% HbE, with the remainder mainly HbF. [2]
Reported ranges vary somewhat by analytical method and study population.
Hemoglobin may be normal or only mildly reduced.
The CBC is therefore extremely useful.
An individual with no HbA, very high HbE, low HbF, and relatively mild hematological changes raises a very different question from someone with no HbA, severe anemia, marked microcytosis, and a large HbF fraction.
The absence of HbA narrows the possibilities.
It does not finish the diagnosis.
HbA Can Still Be Present in HbE/Beta-Plus Thalassemia
A β⁺-thalassemia allele still produces some βA globin.
Therefore HbA may remain detectable in HbE/β⁺-thalassemia.
The amount depends on how much residual β-globin production the β⁺ allele allows.
This creates another trap.
A pattern with HbA present does not automatically mean simple HbE trait.
Jomoui and colleagues specifically investigated genetically confirmed HbE/β⁺-thalassemia cases whose hemoglobin phenotype resembled HbE heterozygosity closely enough to create a risk of misclassification. Some cases had low HbF and relatively mild hematological findings. [7]
So when HbA is present, I still ask how much HbA is present, how abnormal the CBC is, what HbF is doing, whether the HbE fraction fits, whether iron studies are normal, and whether the overall phenotype makes sense.
HbA is a powerful clue.
It is not a standalone genotype test.
HbF Changes the Question Again
HbF becomes particularly useful once the pattern stops looking like simple HbE trait.
In uncomplicated HbE trait, HbF is generally low.
In HbE/β-thalassemia, HbF may be substantially increased, although the amount varies widely with genotype and modifying factors. [1]
So if I see significant anemia, marked microcytosis, HbE, and clearly increased HbF, simple HbE trait becomes less convincing as the complete explanation.
HbF also helps when HbA is absent.
No HbA with very high HbE, relatively low HbF, and a mild phenotype may fit homozygous HbE better.
No HbA with a smaller HbE fraction, substantial HbF, and significant anemia raises much greater concern for HbE/β⁰-thalassemia.
The whole pattern matters.
The Analytical Platform Matters
HbE is one of the best examples of why hemoglobin analysis has to be interpreted with knowledge of the instrument.
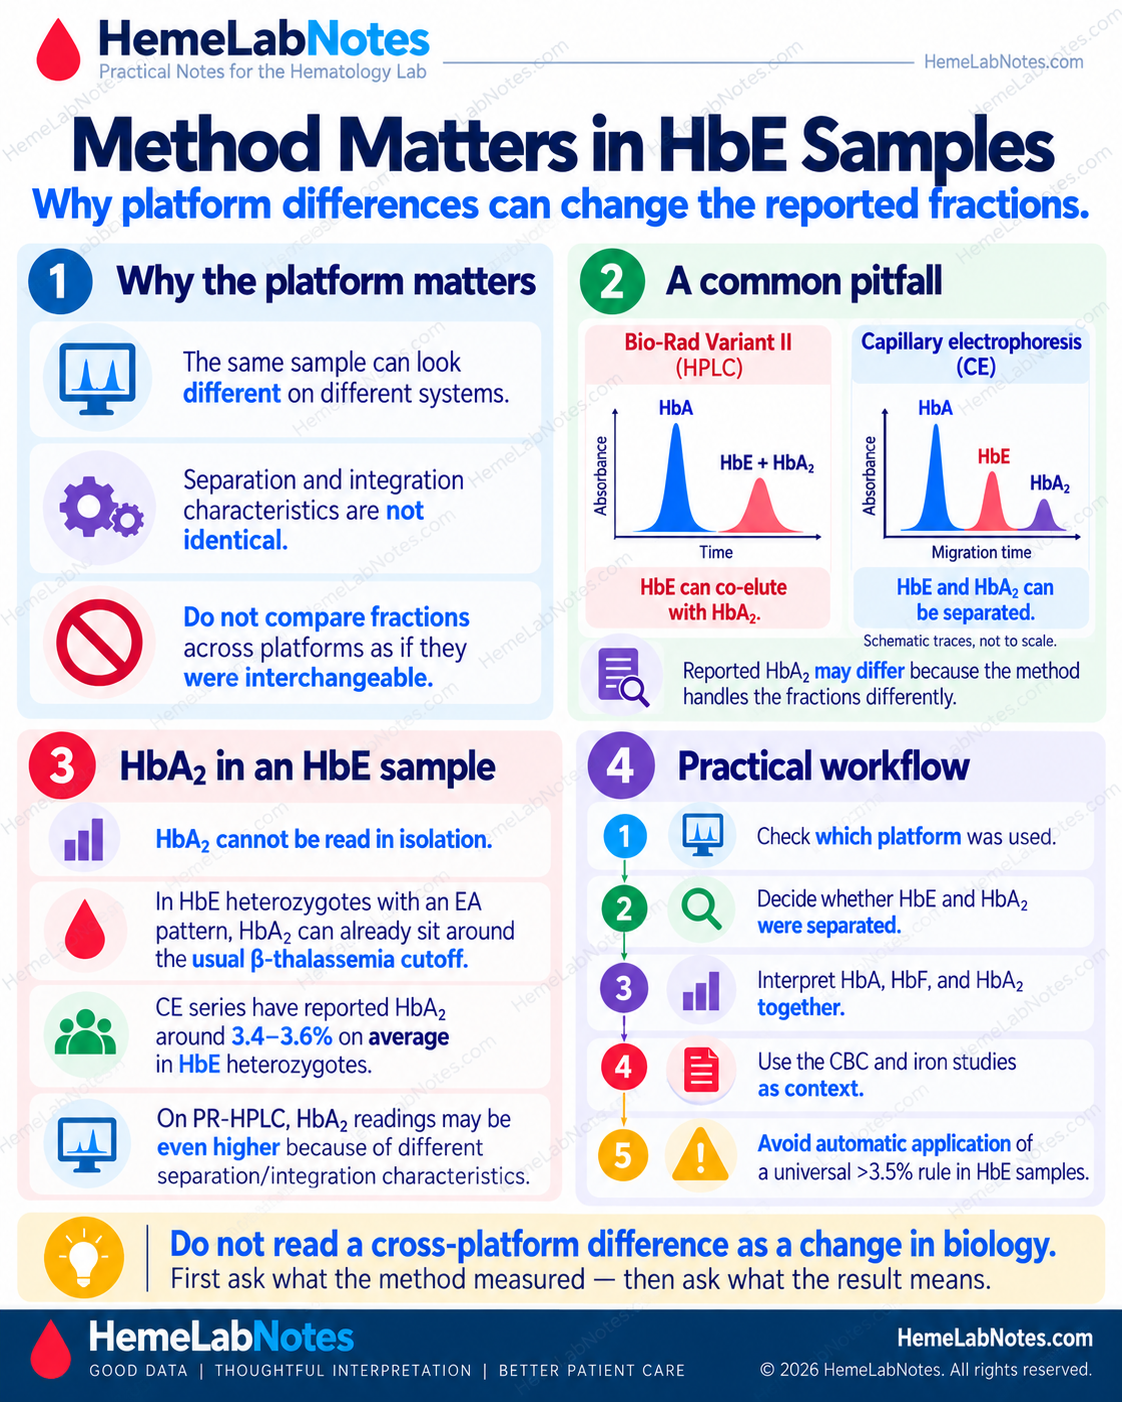
On the Bio-Rad Variant II β-thalassemia program, HbE can co-elute with HbA₂.
The reported HbE-containing area therefore may include both HbE and HbA₂.
That makes independent HbA₂ quantification difficult.
Capillary electrophoresis systems such as Sebia Capillarys can separate HbE and HbA₂ into distinct fractions.
Higgins and colleagues found Capillarys 2 superior to Variant II for HbA₂ quantification in samples containing HbE. [3]
Comparative HPLC work has also shown that HbE and HbA₂ separation depends on the analytical platform. [4]
So when I review an HbE-containing result, I want to know which analyzer generated it, which program was used, whether HbE co-elutes with HbA₂, whether HbA₂ is independently quantified, and whether previous testing used the same method.
Do Not Compare HbE Percentages Across Platforms Too Casually
The newer high-resolution HPLC data make this especially clear.
In 650 HbE heterozygotes tested by both capillary electrophoresis and PR-HPLC, the mean HbE values were relatively close: 21.77% by CE versus 22.06% by PR-HPLC. [9]
HbA₂ behaved quite differently: 3.50% by CE versus 4.71% by PR-HPLC.
Consequently, the combined HbE+HbA₂ values were 25.27% by CE versus 26.77% by PR-HPLC. [9]
The same specimens therefore generated different quantitative relationships depending on how the fractions were separated and integrated.
This is why I do not compare an old HbE percentage with a new one until I know whether the analytical platform and reporting convention are the same.
A change in number is not automatically a change in biology.
HbA₂ in an HbE Sample Needs Its Own Caution
Even when capillary electrophoresis successfully separates HbE from HbA₂, another issue remains.
HbA₂ in HbE heterozygotes may itself sit somewhat higher than in ordinary adults.
A Malaysian CE series reported a mean HbA₂ of 3.58% with an SD of 0.44% in HbE heterozygotes. [8]
Mais and colleagues likewise found HbA₂ to be higher in HbE heterozygotes than in controls: 3.4 ± 0.4% versus 2.6 ± 0.4%. [10]
The 2026 study reached a very similar result by CE in 650 HbE heterozygotes: mean HbA₂ was 3.50 ± 0.4%, with a range of 1.8–5.2%. [9]
On PR-HPLC, the same group showed a higher mean HbA₂ value of 4.71%, reflecting the different analytical separation and integration characteristics of that system. [9]
That means the familiar generic rule:
HbA₂ >3.5% → β-thalassemia trait
cannot simply be imported into an HbE-containing sample.
First ask whether HbA₂ is genuinely separated from HbE, what the validated method-specific reference or decision limit is, whether the CBC supports β-thalassemia, and what HbA and HbF are doing.
A number close to a familiar cutoff is not enough.
The CBC Can Tell You When “HbE Trait” Does Not Fit
Consider two very different patterns.
In the first, hemoglobin is near normal, MCV is only mildly reduced, HbA is clearly predominant, HbE sits around the expected simple-trait range, HbF is low, and iron studies are not deficient.
That fits uncomplicated HbE trait reasonably well.
In the second, hemoglobin is 8–9 g/dL, MCV is around 60 fL, MCH is markedly reduced, HbF is substantially increased, HbA is absent or much lower than expected, and iron deficiency does not explain the severity.
That does not fit simple HbE trait.
The HbE finding is real in both cases.
But the biological context is completely different.
When the CBC looks too abnormal for uncomplicated HbE trait, I do not force the report into “HbE trait.”
HbE/Beta-Thalassemia Has a Wide Phenotypic Range
HbE/β-thalassemia is not one uniform disease.
The phenotype can range from relatively mild anemia to severe transfusion-dependent disease.
Part of that variation reflects whether the accompanying β-thalassemia allele is β⁰ or β⁺.
But other modifiers matter too, including α-globin genotype, genetic factors affecting HbF production, the specific β-thalassemia mutation, and other genetic or clinical modifiers. [1,6]
This is why two patients carrying broadly similar HbE/β-thalassemia labels may have very different hemoglobin levels, HbF percentages, clinical courses, and transfusion requirements.
Laboratory interpretation should recognize when the pattern is more complex than simple HbE trait without claiming an exact genotype that routine hemoglobin analysis cannot establish.
Previous Results Still Matter
Previous CBCs are often extremely useful.
Suppose someone has shown Hb near normal, MCV around 76 fL, stable RDW, and a similar HbE fraction for many years.
Now the current sample shows Hb 10 g/dL, MCV 66 fL, increased RDW, and low ferritin.
The HbE did not suddenly become more severe.
Something new happened.
Iron deficiency becomes a much more satisfying explanation for the change.
A genetic trait is usually stable. A changing CBC should make you look for what changed.
Three Bench Examples
Example A — A Pattern That Fits Simple HbE Trait
The CBC shows Hb 13.0 g/dL, RBC 5.0 ×10¹²/L, MCV 77 fL, MCH approximately 26 pg, and relatively stable RDW.
Ferritin and transferrin saturation are not reduced.
Hemoglobin analysis shows predominant HbA, an HbE-containing fraction of approximately 27%, and low HbF.
This is internally coherent.
The anemia is absent.
Microcytosis is mild.
HbA remains predominant.
The HbE fraction lies within the classic range described for uncomplicated HbE trait. [1,2]
Nothing in the CBC demands a more severe explanation.
Example B — HbE Trait With New Iron Deficiency
Previous CBCs showed hemoglobin near normal, MCV around 76–78 fL, and relatively stable RDW.
The current CBC shows Hb 10.1 g/dL, MCV 67 fL, reduced MCH, and increased RDW.
Ferritin and transferrin saturation are low.
Hemoglobin analysis still shows HbA, an HbE fraction somewhat lower than previously, and low HbF.
The historical pattern was mild and stable.
The current iron studies provide an acquired explanation for the worsening anemia and microcytosis.
This does not need to be forced into HbE/β-thalassemia simply because the CBC looks worse today.
HbE trait and iron deficiency can coexist.
Example C — HbE Present, but Simple Trait Does Not Fit
The CBC shows Hb 8.4 g/dL, MCV 60 fL, markedly reduced MCH, and iron studies that do not explain the severity.
Hemoglobin analysis shows HbE, clearly increased HbF, and HbA that is absent or markedly reduced.
This is not a simple HbE-trait pattern.
If HbA is completely absent, the important differential includes HbE/β⁰-thalassemia and homozygous HbE.
CBC severity, HbE proportion, and HbF help separate them.
A patient with severe anemia, marked microcytosis, and substantial HbF is much less compatible with uncomplicated homozygous HbE.
If HbA remains present but is clearly reduced, HbE/β⁺-thalassemia remains possible.
At this point, phenotype alone may no longer be enough.
Molecular testing may be appropriate.
When Molecular Testing Becomes More Useful
I think more strongly about molecular investigation when HbE occurs with unexpectedly severe anemia, marked microcytosis not explained by iron deficiency, absent or unusually low HbA, substantially increased HbF, an HbE fraction that does not fit the CBC, suspected HbE/β-thalassemia, suspected HbE with α-thalassemia, discrepant HPLC and capillary electrophoresis findings, reproductive implications, or a need for definitive genotype rather than presumptive phenotype.
For suspected β-thalassemia, definitive characterization requires appropriate HBB molecular analysis when the exact genotype matters. [6]
For suspected α-thalassemia, α-globin testing may be required depending on the phenotype and clinical question.
The hemoglobin analyzer is an excellent screening instrument.
It is not a DNA sequencer.
A Practical Bench Sequence
My sequence is straightforward.
First, review the CBC and decide whether the severity fits uncomplicated HbE trait.
Second, look backward at previous results and decide whether the pattern is stable.
Third, review iron status.
Fourth, look at HbA and decide whether it is predominant, reduced, or absent.
Fifth, review the HbE-containing fraction in the context of the platform.
Sixth, look at HbF.
Seventh, understand whether the method separates HbE from HbA₂ and whether HbA₂ is independently quantified.
Eighth, compare everything again and ask whether simple HbE trait explains the whole pattern.
Ninth, if it does not, consider iron deficiency, α-thalassemia, HbE/β⁺-thalassemia, HbE/β⁰-thalassemia, homozygous HbE, or another interacting hemoglobin disorder.
Finally, use molecular testing when definitive characterization matters.
Common Interpretation Traps
Trap 1 — “There is an HbE peak, therefore this is HbE trait”
An HbE-containing fraction requires interpretation.
It does not establish the complete genotype.
Trap 2 — “HbE is 25%, therefore α-thalassemia is excluded”
HbE with heterozygous α⁺-thalassemia may remain in the same approximate 25–30% range as uncomplicated HbE trait. [2]
Trap 3 — “Low HbE proves α⁰-thalassemia”
A low HbE fraction is a useful screening clue, not a molecular diagnosis.
On PR-HPLC, HbE <19.0% gave excellent sensitivity and specificity, but even a strong screening test produces false positives. [9]
The study also showed that older combined-fraction thresholds had lower specificity, and positive predictive value depended strongly on the prevalence of α⁰-thalassemia in the tested population.
A low HbE result should trigger the next question, not end the investigation.
Trap 4 — “No HbA means HbE/β⁰-thalassemia”
Homozygous HbE also lacks HbA.
CBC severity, HbE proportion, HbF, and clinical context help distinguish them.
Trap 5 — “HbA is present, so HbE/β-thalassemia is excluded”
HbA can remain present in HbE/β⁺-thalassemia. [7]
In one Thai cohort, HbE ≥35% was a highly effective screening marker for HbE/β⁺-thalassemia among HbE+HbA samples, but that cutoff should remain population- and method-specific. [7]
Trap 6 — “HbA₂ above 3.5% proves β-thalassemia”
Not in an HbE-containing sample without method-specific interpretation.
CE studies report HbA₂ means around 3.4–3.6% in HbE heterozygotes with an EA pattern. [8–10]
First determine whether HbA₂ is measured separately from HbE and then interpret it using the laboratory’s validated method and the rest of the pattern.
Trap 7 — “The analyzer identified HbE, so no further confirmation is ever needed”
Routine HPLC and capillary electrophoresis provide powerful presumptive identification.
Complex or clinically consequential patterns may still require complementary or molecular testing.
What the Laboratory Can Say — and What It Cannot
The laboratory can recognize an HbE-containing pattern.
It can show whether HbA is present.
It can quantify HbF.
It can determine whether the CBC looks mild or disproportionately abnormal.
It can identify iron deficiency.
It can recognize an unexpectedly low or high HbE fraction.
And it can determine whether the analytical method has an HbE/HbA₂ limitation.
But one chromatographic peak should not be turned into an exact genotype without enough evidence.
The useful interpretation comes from fitting the hemoglobin pattern to the CBC, previous results, iron status, HbA, HbF, HbA₂, the analytical method, and the clinical question.
The Takeaway
HbE is often easy to recognize.
Understanding what the HbE means can be harder.
Simple HbE trait usually produces a relatively mild phenotype, with HbA remaining predominant and HbE commonly around 25–30%.
But that pattern can be altered by iron deficiency, α-thalassemia, β-thalassemia, homozygous HbE, HbF modifiers, and the analytical platform.
HbA is one of the most useful clues.
So is HbF.
The HbE percentage matters, but only in the context of what the method actually measured.
A low value can point toward α⁰-thalassemia.
A high value can point toward β-thalassemia interaction.
Neither direction should be converted into a universal genotype cutoff.
And the CBC should always tell you whether the proposed interpretation is believable.
A large discrepancy between the CBC and a presumed simple HbE trait is not something to ignore.
It is often the clue that another process is present.
Do not ask only whether HbE is present. Ask whether HbE alone explains the whole pattern.
References
-
Fucharoen S, Weatherall DJ. The hemoglobin E thalassemias. Cold Spring Harb Perspect Med. 2012;2(8):a011734. doi:10.1101/cshperspect.a011734.
-
Angastiniotis M, Eleftheriou A, Galanello R, et al., authors; Old J, editor. Prevention of Thalassaemias and Other Haemoglobin Disorders: Volume 1: Principles [Internet]. 2nd ed. Nicosia (Cyprus): Thalassaemia International Federation; 2013. Chapter 4, Screening and Diagnosis for Haemoglobin Disorders.
-
Higgins TN, Khajuria A, Mack M. Quantification of HbA₂ in patients with and without β-thalassemia and in the presence of HbS, HbC, HbE, and HbD Punjab hemoglobin variants: comparison of two systems. Am J Clin Pathol. 2009;131(3):357–362. doi:10.1309/AJCP28QKSOPHYOBC.
-
Chopra P, Bhardwaj S, Negi P, Arora A. Comparison of two high-pressure liquid chromatography instruments Bio-Rad Variant-II and Tosoh HLC-723G11 in the evaluation of hemoglobinopathies. Indian J Hematol Blood Transfus. 2020;36(4):725–732. doi:10.1007/s12288-020-01298-5.
-
Pornprasert S, Tookjai M, Punyamung M, Pongpunyayuen P. HbE level and red cell parameters in heterozygous HbE with and without α⁰-thalassemia trait. Indian J Hematol Blood Transfus. 2018;34(4):662–665. doi:10.1007/s12288-018-0947-8.
-
Langer AL. Beta-Thalassemia. In: Adam MP, Bick S, Mirzaa GM, et al., eds. GeneReviews® [Internet]. Seattle (WA): University of Washington, Seattle; 1993–2026. Updated February 12, 2026.
-
Jomoui W, Satthakarn S, Panyasai S. Molecular understanding of unusual HbE-β⁺-thalassemia with Hb phenotype similar to HbE heterozygote: simple and rapid differentiation using HbE levels. Ann Med. 2023;55(2):2267054. doi:10.1080/07853890.2023.2267054.
-
Hafiza A, Malisa MY, Khirotdin RD, Azlin I, Azma Z, Thong MC, et al. HbA₂ levels in normal, β-thalassaemia and haemoglobin E carriers by capillary electrophoresis. Malays J Pathol. 2012;34(2):161–164.
-
Srisuwan W, Satthakarn S, Panyasai S. Assessment of a high-resolution HPLC system to quantify HbE for α⁰-thalassemia diagnosis in HbE heterozygotes. Ann Lab Med. 2026;46(5):528–538. doi:10.3343/alm.2025.0552.
-
Mais DD, Gulbranson RD, Keren DF. The range of hemoglobin A₂ in hemoglobin E heterozygotes as determined by capillary electrophoresis. Am J Clin Pathol. 2009;132(1):34–38. doi:10.1309/AJCPP50JIXXZVLSS.
Further Reading
Bain BJ, Bates I, Laffan MA. Dacie and Lewis Practical Haematology. 12th ed. Elsevier; 2017.
Keohane EM, Preston MM, Mirza KM, Walenga JM, eds. Rodak’s Hematology: Clinical Principles and Applications. 7th ed. Elsevier; 2024.