A low MCV gives direction. It doesn’t give the cause.
When microcytosis shows up on a CBC, iron deficiency is often the first thing that comes to mind — but the pattern should come before the label.
Two patients can share the same MCV and be heading in completely different directions.
One might show a gradually falling hemoglobin, a widening RDW, and a lower RBC count.
Another might show marked microcytosis with a preserved or high RBC count and barely any change over several years.
The MCV looks the same either way.
The pattern behind it doesn’t.
So the practical question isn’t:
Why is the MCV low?
It is:
What combination of findings actually explains this particular pattern?
Start With the Hemoglobin — But Don’t Stop There
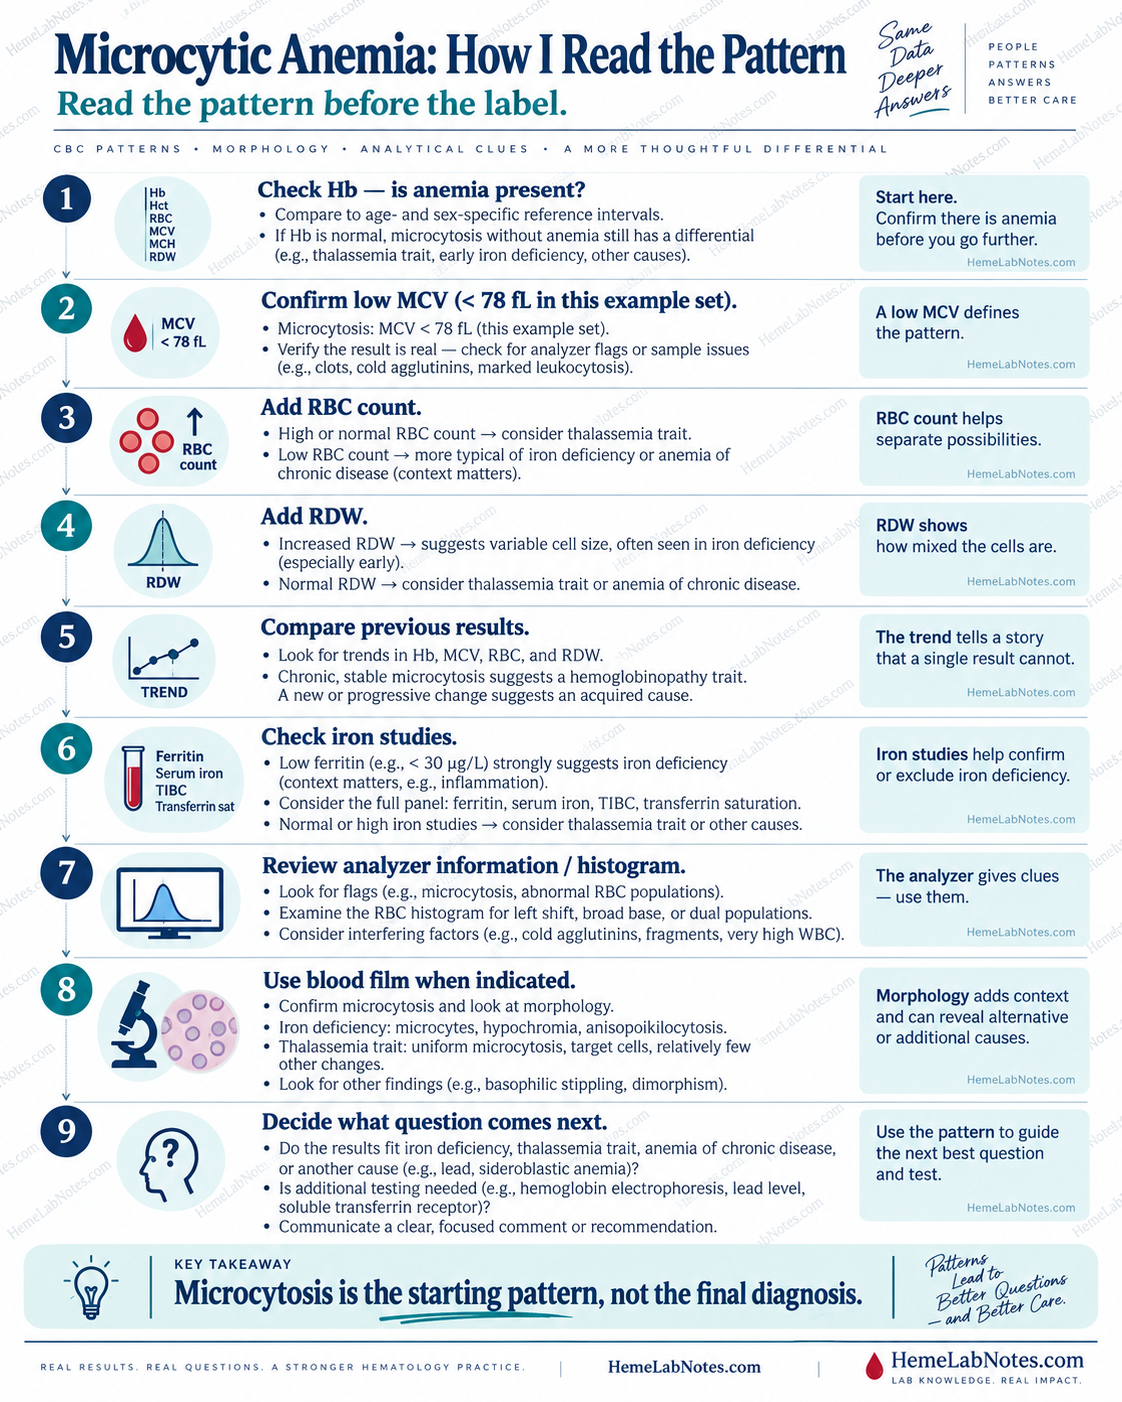
First question: is anemia actually present?
Compare the hemoglobin with the laboratory’s validated reference interval and consider relevant patient factors when appropriate.
If both hemoglobin and MCV are low, the picture is consistent with microcytic anemia.
But a normal hemoglobin doesn’t make microcytosis irrelevant.
Microcytosis can appear before hemoglobin falls below the reference interval, and some patients carry a stable microcytic pattern with little or no anemia.
A normal hemoglobin is a reason to keep reading the red-cell pattern, not to close the review.
For HemeLabNotes examples:
- Microcytic: MCV <78 fL
- Normocytic: MCV ≥78 fL to <98 fL
- Macrocytic: MCV ≥98 fL
These are example ranges. Laboratories should use their own validated reference intervals.
Confirm the Microcytosis Is Real
Before interpreting the cause, check that the number itself is believable.
Ask:
- Does the MCV fit the rest of the CBC?
- Does it match previous results?
- Are there unexpected analyzer flags?
- Does the RBC histogram look unusual?
- Is there any reason to suspect a preanalytical or analytical problem?
A single low MCV shouldn’t be read in isolation.
An MCV of 68 fL after years of results around 88–90 fL deserves far more attention than an MCV that has remained between 67 and 70 fL for years.
The number matters.
The change in the number often matters more.
RDW Shows the Variation, Not the Cause
Once the microcytosis checks out, RDW adds another part of the pattern.
An increased RDW tells us that red-cell size variation has increased.
It doesn’t tell us why.
A developing iron-restricted process may produce increasing anisocytosis as newer, smaller red cells enter the circulation alongside an older population of larger cells.
That may give:
low MCV + rising RDW
Useful clue.
Not diagnosis.
A relatively stable RDW with persistent microcytosis suggests a more uniform red-cell population.
Again, that narrows the question.
It doesn’t answer it.
RDW describes the distribution of cell sizes.
That is its job.
Now Look at the RBC Count
This is one of the more useful numbers to add to a microcytic pattern.
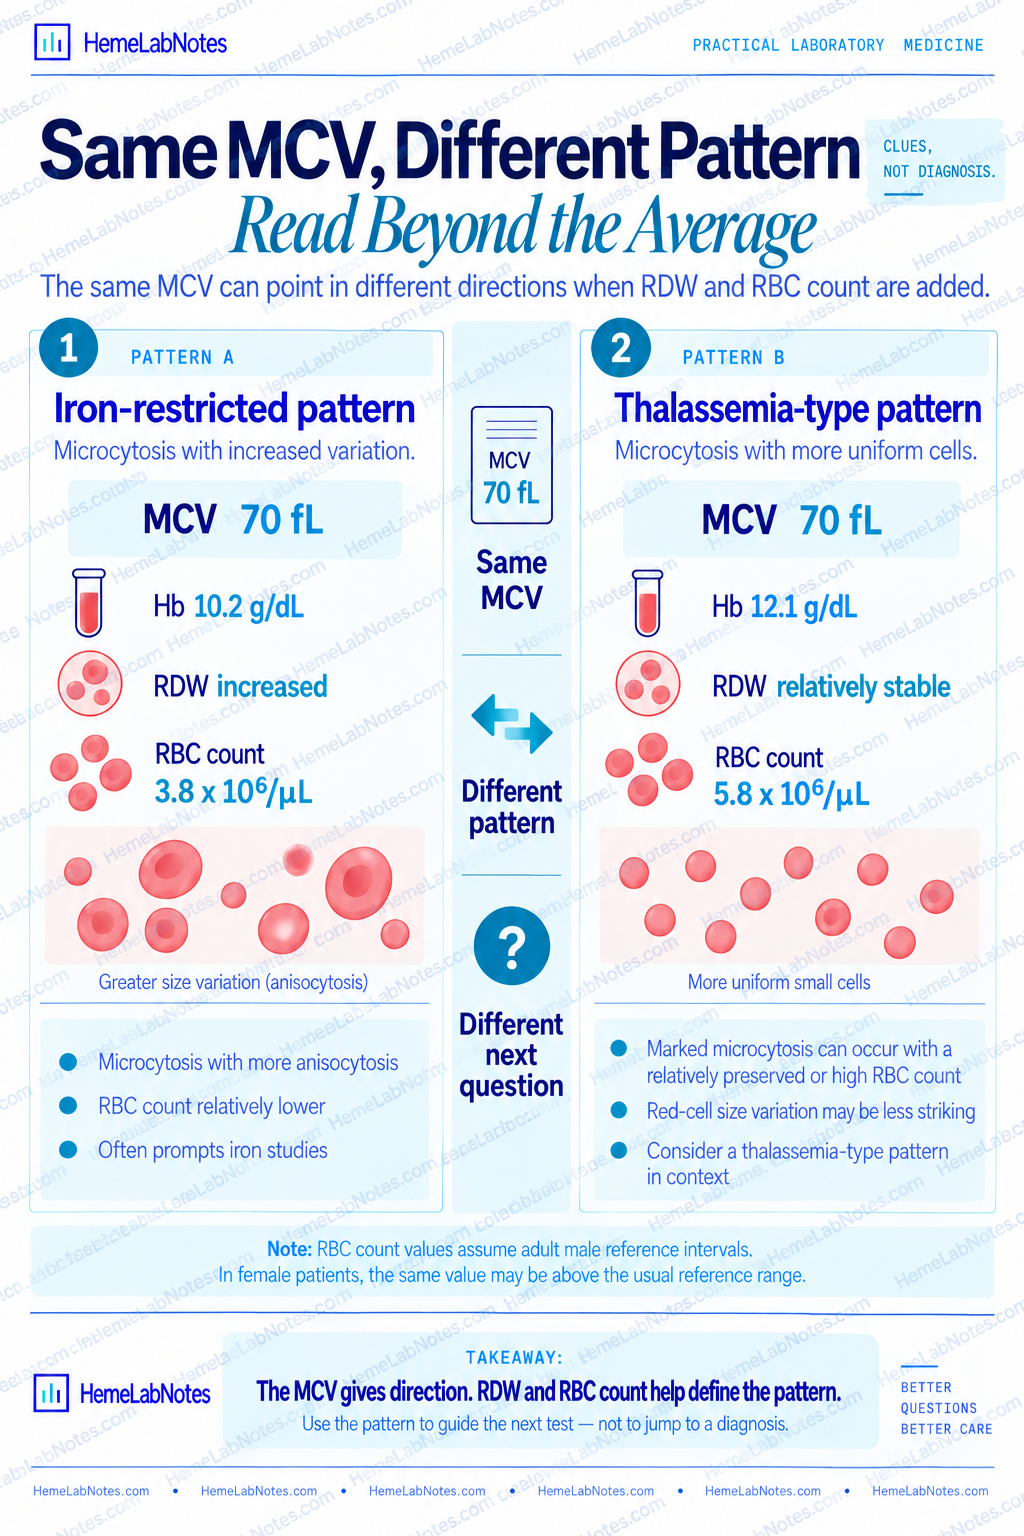
Pattern A
- Hb: decreased
- MCV: 70 fL
- RDW: increased
- RBC count: 3.8 ×10⁶/µL
Microcytosis, wider size variation, and a relatively lower RBC count together may support an iron-restricted pattern.
But iron studies still need to show that the explanation fits.
Pattern B
- Hb: mildly decreased or near the reference interval
- MCV: 70 fL
- RDW: fairly stable
- RBC count: 5.8 ×10⁶/µL
Same low MCV.
Different pattern.
A preserved or elevated RBC count shifts consideration toward a thalassemia-type pattern — something the MCV alone cannot show.
Same MCV. Different pattern. Different next question.
A high RBC count doesn’t diagnose thalassemia.
A lower RBC count doesn’t diagnose iron deficiency.
They change the direction of the investigation.
MCH Adds Supportive Information
MCH usually falls alongside MCV because smaller red cells generally contain less hemoglobin.
That can support the overall microcytic-hypochromic pattern.
But MCH shouldn’t stand on its own.
It becomes more useful when it agrees with the rest of the indices.
For example:
low MCV + low MCH + compatible RBC count + compatible RDW
tells a much more coherent story than an isolated low MCH.
MCHC can add context too, but for common microcytic patterns it usually contributes less than MCV, RDW, and RBC count.
The point isn’t to interpret more numbers.
It is to ask whether the numbers are telling the same story.
Previous Results Can Change the Whole Interpretation
Few tools matter more in microcytosis than the patient’s own history.
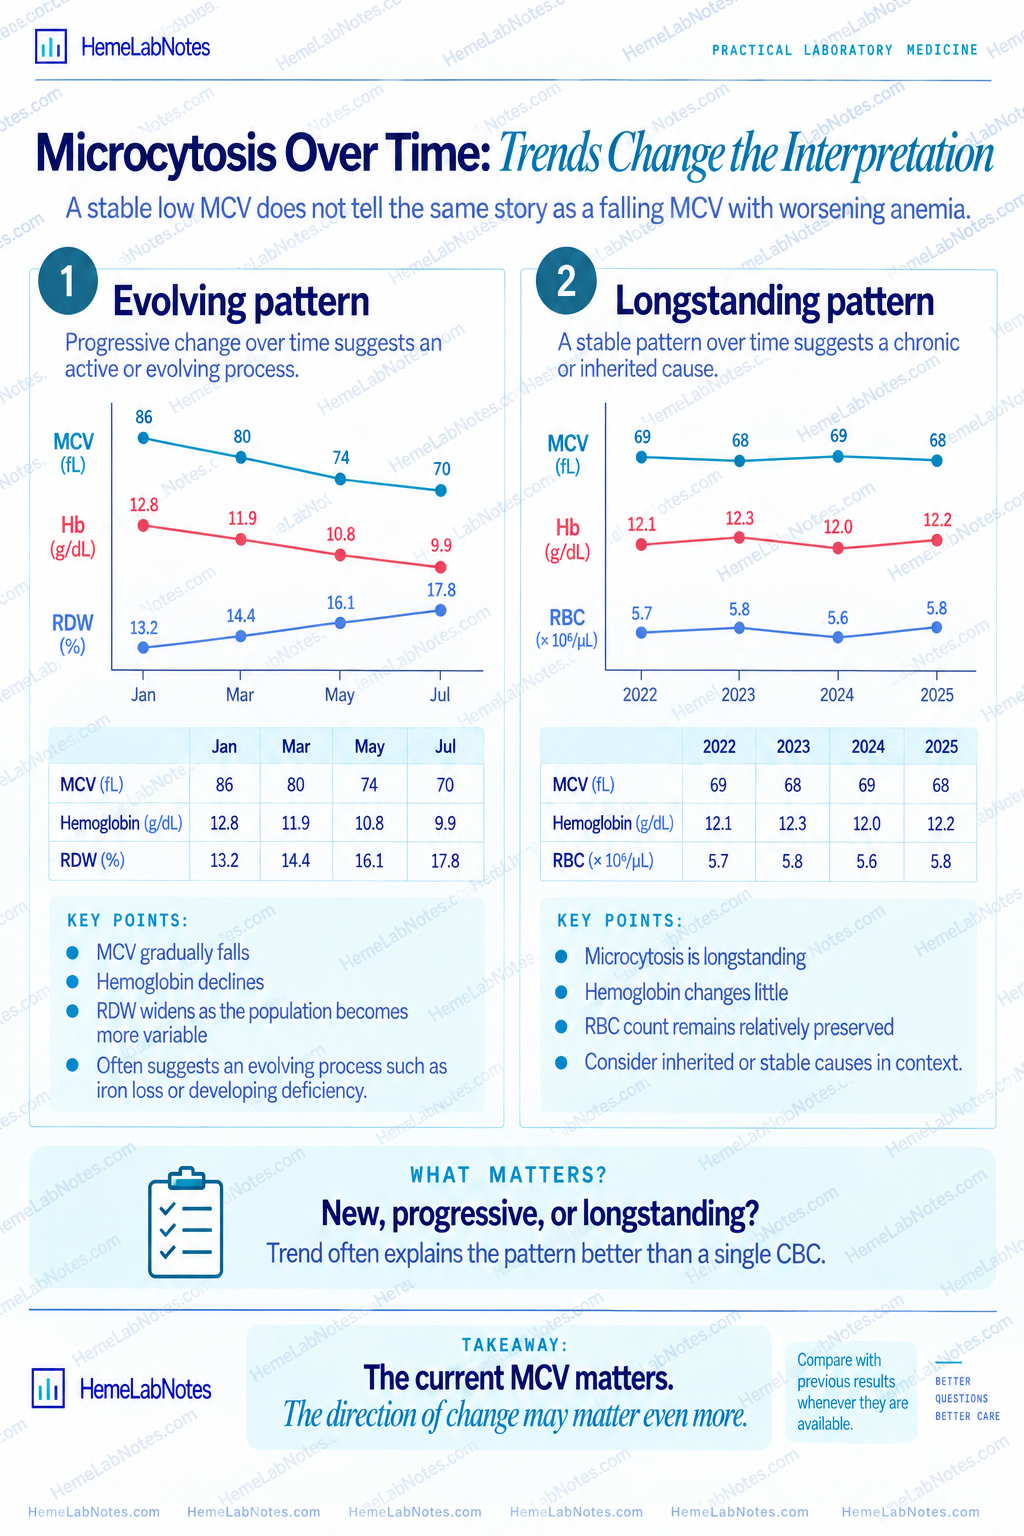
Consider one patient who previously had:
- MCV 87 fL
- normal RDW
- normal hemoglobin
Then over time:
- MCV falls
- RDW rises
- hemoglobin drops
That is an evolving pattern.
Now compare it with someone whose MCV has remained around 68 fL for years with stable hemoglobin and a relatively preserved RBC count.
One is moving.
The other isn’t.
That distinction may matter more than the current MCV itself.
Whenever possible, ask:
Is this microcytosis new, progressive, or longstanding?
Iron Studies Change the Interpretation
Once the CBC suggests a possible iron-restricted pattern, iron studies test whether that interpretation holds up.
The core panel commonly includes:
- ferritin
- transferrin or TIBC
- transferrin saturation
- serum iron
Read them together.
Not one at a time.
A low ferritin strongly supports depleted iron stores.
But ferritin is also an acute-phase reactant, so a normal or elevated result does not always exclude iron deficiency when inflammation or another ferritin-raising condition is present.
Serum iron also varies and shouldn’t be interpreted alone.
Same principle as the CBC:
Interpret the pattern, not the single number.
When the CBC and iron studies disagree, that is a reason to stop and reconsider.
Not a reason to force them to fit.
When the Iron Studies Don’t Fit
A common mistake is holding on to an iron-deficiency explanation after the iron studies stop supporting it.
If the microcytosis is significant but iron studies don’t support iron depletion, widen the differential.
Depending on the context, possibilities may include:
- thalassemia or another hemoglobinopathy
- anemia associated with inflammation or chronic disease
- sideroblastic processes
- lead-related disorders
- mixed processes
The CBC doesn’t establish any of these.
It tells us when the first explanation is no longer good enough.
That is when the next question changes.
Be Careful With Discriminant Indices
The Mentzer index is probably the best known:
MCV ÷ RBC count
A lower result has traditionally been associated with thalassemia-type patterns, while a higher result may support iron deficiency.
It can be useful as a screening clue.
But it isn’t a diagnostic test.
Its performance varies between populations, age groups, and clinical settings, and mixed conditions can make it less useful.
For bench review, I find the underlying pattern more helpful than memorizing a cutoff:
- How low is the MCV?
- What is the RBC count doing?
- What is the RDW doing?
- What is the hemoglobin doing?
- Has any of it changed?
Those answers are already sitting in the CBC.
The Blood Film Can Explain What the Numbers Can’t
Not every patient with microcytosis needs a blood film.
But when the automated pattern doesn’t fully explain the result, morphology can fill in the gaps.
You may see:
- microcytosis
- hypochromia
- anisocytosis
- poikilocytosis
- target cells
- pencil or elongated cells
- mixed red-cell populations
None of these findings is disease-specific on its own.
Target cells, for example, occur in more than one condition.
So the useful question isn’t:
“I found a target cell — what diagnosis is this?”
It is:
“Does the morphology support the CBC pattern, or is it showing something the averages were hiding?”
A Normal MCV Can Hide Two Populations
This becomes important when more than one red-cell population is present.
One population may be smaller.
Another may be larger.
The combined average can fall inside the reference interval even though the underlying populations are different and the average is misleading.
This may occur with:
- mixed nutritional deficiencies
- treatment response
- reticulocytosis
- recent transfusion
That is why RDW, the histogram, previous results, and the blood film can sometimes reveal more than the MCV alone. The same issue is explored in the guide to MCV interpretation.
The average is useful.
But the average can hide the distribution.
Recent Transfusion Can Change the Pattern
Transfusion can complicate red-cell interpretation.
Donor and patient red cells form two populations that may differ in average volume.
The reported MCV therefore reflects both populations.
RDW may increase.
The histogram may broaden or become bimodal.
If the CBC pattern changes unexpectedly, check the transfusion history before assuming the underlying disease itself has changed.
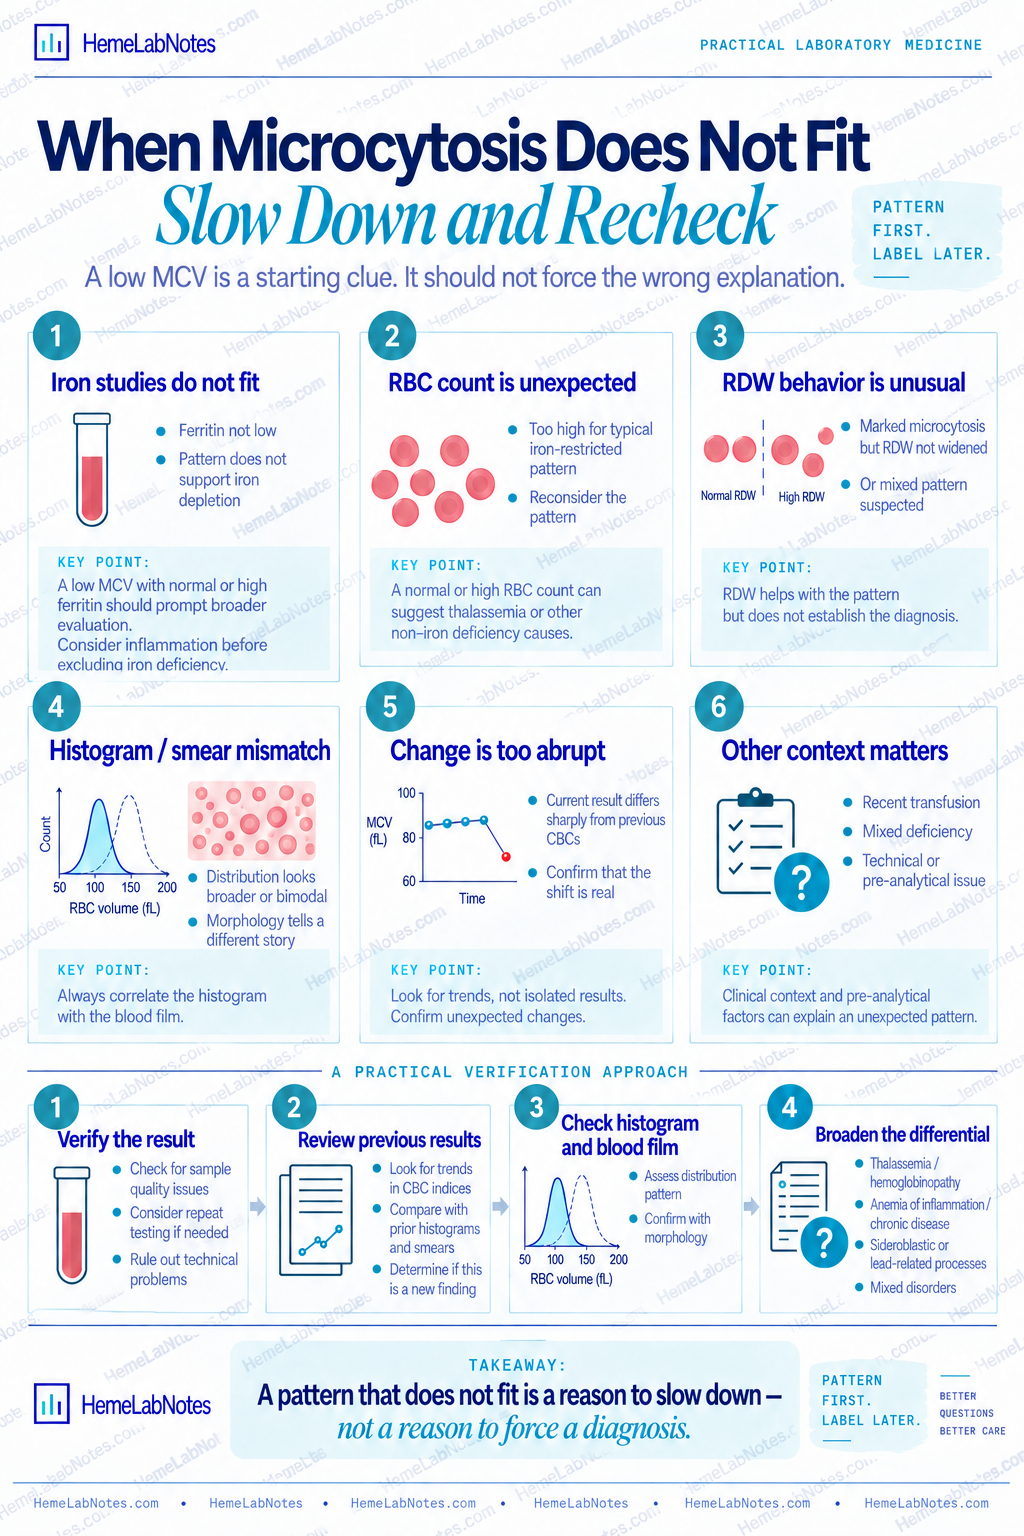
When the Pattern Doesn’t Fit, Slow Down
Look more closely when:
- the MCV changes abruptly
- the degree of microcytosis seems out of proportion to the anemia
- the RBC count is unexpectedly high or low for the apparent pattern
- RDW disagrees with the rest of the CBC
- iron studies contradict the initial interpretation
- the histogram looks unusual
- the blood film shows unexpected morphology
- previous results tell a different story
None of these is a diagnosis.
They are signals.
A pattern that doesn’t fit is a reason to slow down, not a reason to force an answer onto it.
Three Bench Examples
Example 1 — Evolving iron-restricted pattern
- Hemoglobin: 10.4 g/dL
- MCV: 72 fL
- RDW: increased
- RBC count: relatively lower
Previous results show a falling hemoglobin and MCV with a widening RDW.
Iron studies are the logical next check.
The CBC points the investigation in a direction. It does not establish the diagnosis.
Example 2 — Longstanding microcytosis with preserved RBC count
- Hemoglobin: near the lower reference interval
- MCV: 68 fL
- RDW: relatively stable
- RBC count: relatively high
Previous results show a similar pattern over several years.
This shifts consideration toward a thalassemia-type pattern and away from assuming new iron depletion.
Pattern first.
Diagnosis later.
Example 3 — Microcytosis that doesn’t fit the first explanation
- Hemoglobin: decreased
- MCV: decreased
- RDW: increased
The initial pattern raises concern for iron restriction, but iron studies do not support depleted stores.
That mismatch is the finding.
The next question is not how to defend the first impression. It is what else could explain the complete pattern.
A Practical Bench Sequence
- Hemoglobin — Is anemia present?
- MCV — Is the microcytosis real and consistent with the rest of the CBC?
- RDW — Is the red-cell population relatively uniform or increasingly variable?
- RBC count — Is it lower, preserved, or relatively high for the degree of microcytosis?
- MCH — Does it support the same microcytic-hypochromic pattern?
- Previous results — Is this new, progressive, or longstanding?
- Iron studies — Do they support iron depletion, and does inflammation complicate the interpretation?
- Hemoglobin analysis when appropriate — Does a suspected hemoglobinopathy require further evaluation? A normal result does not exclude every thalassemia pattern, so additional testing may still be needed depending on the overall picture.
- Analyzer information — Do flags or the histogram reveal a mismatch or mixed population?
- Blood film — Does morphology support the numerical pattern or reveal something the averages were hiding?
- Further investigation — What explanation fits the whole picture, and what should be checked next under local procedures?
This is the same approach used for reading the CBC as a connected pattern: notice, connect, verify, then interpret.
The Takeaway
Microcytosis isn’t a diagnosis.
Iron deficiency is common enough that a low MCV can feel like it explains itself.
It doesn’t.
Start with the hemoglobin.
Confirm the MCV.
Then bring in RDW, RBC count, MCH, previous results, iron studies, analyzer information, and morphology.
The individual numbers are clues.
The relationship between the numbers is the pattern.
Microcytosis is the starting pattern, not the final diagnosis. Read the indices together, then ask which explanation fits the whole picture.
Educational note: This article is intended for laboratory education and professional discussion. MCV and other reference intervals vary by laboratory, analyzer, method, and population. The HemeLabNotes example cutoffs are not universal. Local validated laboratory procedures take precedence, and results should be correlated with the clinical and laboratory context.
References
- Bain BJ, Bates I, Laffan MA. Dacie and Lewis Practical Haematology. 12th ed. Elsevier; 2017.
- Bain BJ, Leach M. Blood Cells: A Practical Guide. 7th ed. Wiley; 2025.
- Keohane EM, Preston MM, Mirza KM, Walenga JM, eds. Rodak’s Hematology: Clinical Principles and Applications. 7th ed. Elsevier; 2024.
- Camaschella C. Iron-deficiency anemia. New England Journal of Medicine. 2015;372:1832–1843. doi:10.1056/NEJMra1401038.
- Mentzer WC Jr. Differentiation of iron deficiency from thalassaemia trait. The Lancet. 1973;1(7808):882. doi:10.1016/S0140-6736(73)91446-3.
- ARUP Consult. Microcytic Anemia Testing Algorithm. Updated February 2024.
- Merck Manual Professional Edition. Evaluation of Anemia.