1. Introduction — Why a New Reagent Lot Can Shift Patient Results
The morning quality control has passed. The analyser is operating normally, the previous reagent lot has performed satisfactorily, and a new lot is ready for use.
Does this mean that patient results will remain unchanged?
Not necessarily.
A reagent lot is manufactured to defined specifications, but manufacturing consistency does not guarantee that two lots will behave identically with every patient specimen. Small differences in reagent composition, stability or analytical response may alter reported values, sometimes without producing an obvious instrument error or quality-control failure [1].
In haematology, even a modest difference may matter when results are close to a clinical decision threshold.
Consider a haemoglobin result near 12.0 g/dL, or a platelet count around 30 × 10⁹/L in a patient with clinically significant bleeding. A shift in either direction may affect how a result is interpreted, although the precise clinical consequences depend on the patient’s condition and the decision being made.
The purpose of reagent lot verification is not to demonstrate that two lots produce perfectly identical numbers. It is to establish whether a change in analytical performance could be important for patient care.
This distinction is central to the discussion that follows.
A new reagent lot may pass routine quality control and still behave differently with patient specimens. A comparison involving several patient samples may fail to reveal a small systematic shift. Even when consecutive lots pass individual checks, their differences may accumulate over time.
A new reagent lot should be evaluated for its effect on patient results, not simply for its ability to produce acceptable QC measurements.
2. Lot Verification, Calibration and Quality Control — Three Different Questions
Calibration, quality control and reagent lot verification contribute to analytical quality, but they do not answer the same question.
Calibration establishes or maintains the relationship between an analytical response and a reported measurement according to the measurement procedure.
Internal Quality Control (IQC) monitors whether an analytical system remains sufficiently stable to meet its established control expectations.
Reagent Lot Verification considers whether introducing a new reagent lot changes the results obtained from patient specimens in a clinically important way.
| Process | Main question | Principal limitation |
|---|---|---|
| Calibration | Is the measurement relationship appropriately established? | Does not independently establish patient-result comparability between lots |
| IQC | Is the analytical system performing as expected against control criteria? | Control material may behave differently from patient specimens |
| Lot comparison | Has the candidate lot changed patient results relative to the current lot? | Depends on sample selection, precision, statistical capability and clinical criteria |
These processes are complementary rather than interchangeable.
A passing QC result cannot replace a patient-sample comparison where one is needed. Similarly, a satisfactory comparison does not remove the need for required QC and calibration checks.
Recalibration requires particular care. Where the manufacturer’s instructions require calibration after a reagent lot change, that requirement should be followed. However, recalibration should not be used merely to conceal an unexplained difference between lots. Any adjustment must be justified and documented.
Reagent lot changes must also be distinguished from QC material lot changes. A new QC material lot may require fresh control target assignment, whereas a new analytical reagent lot raises questions about the comparability of patient results. These are different events requiring different decisions.
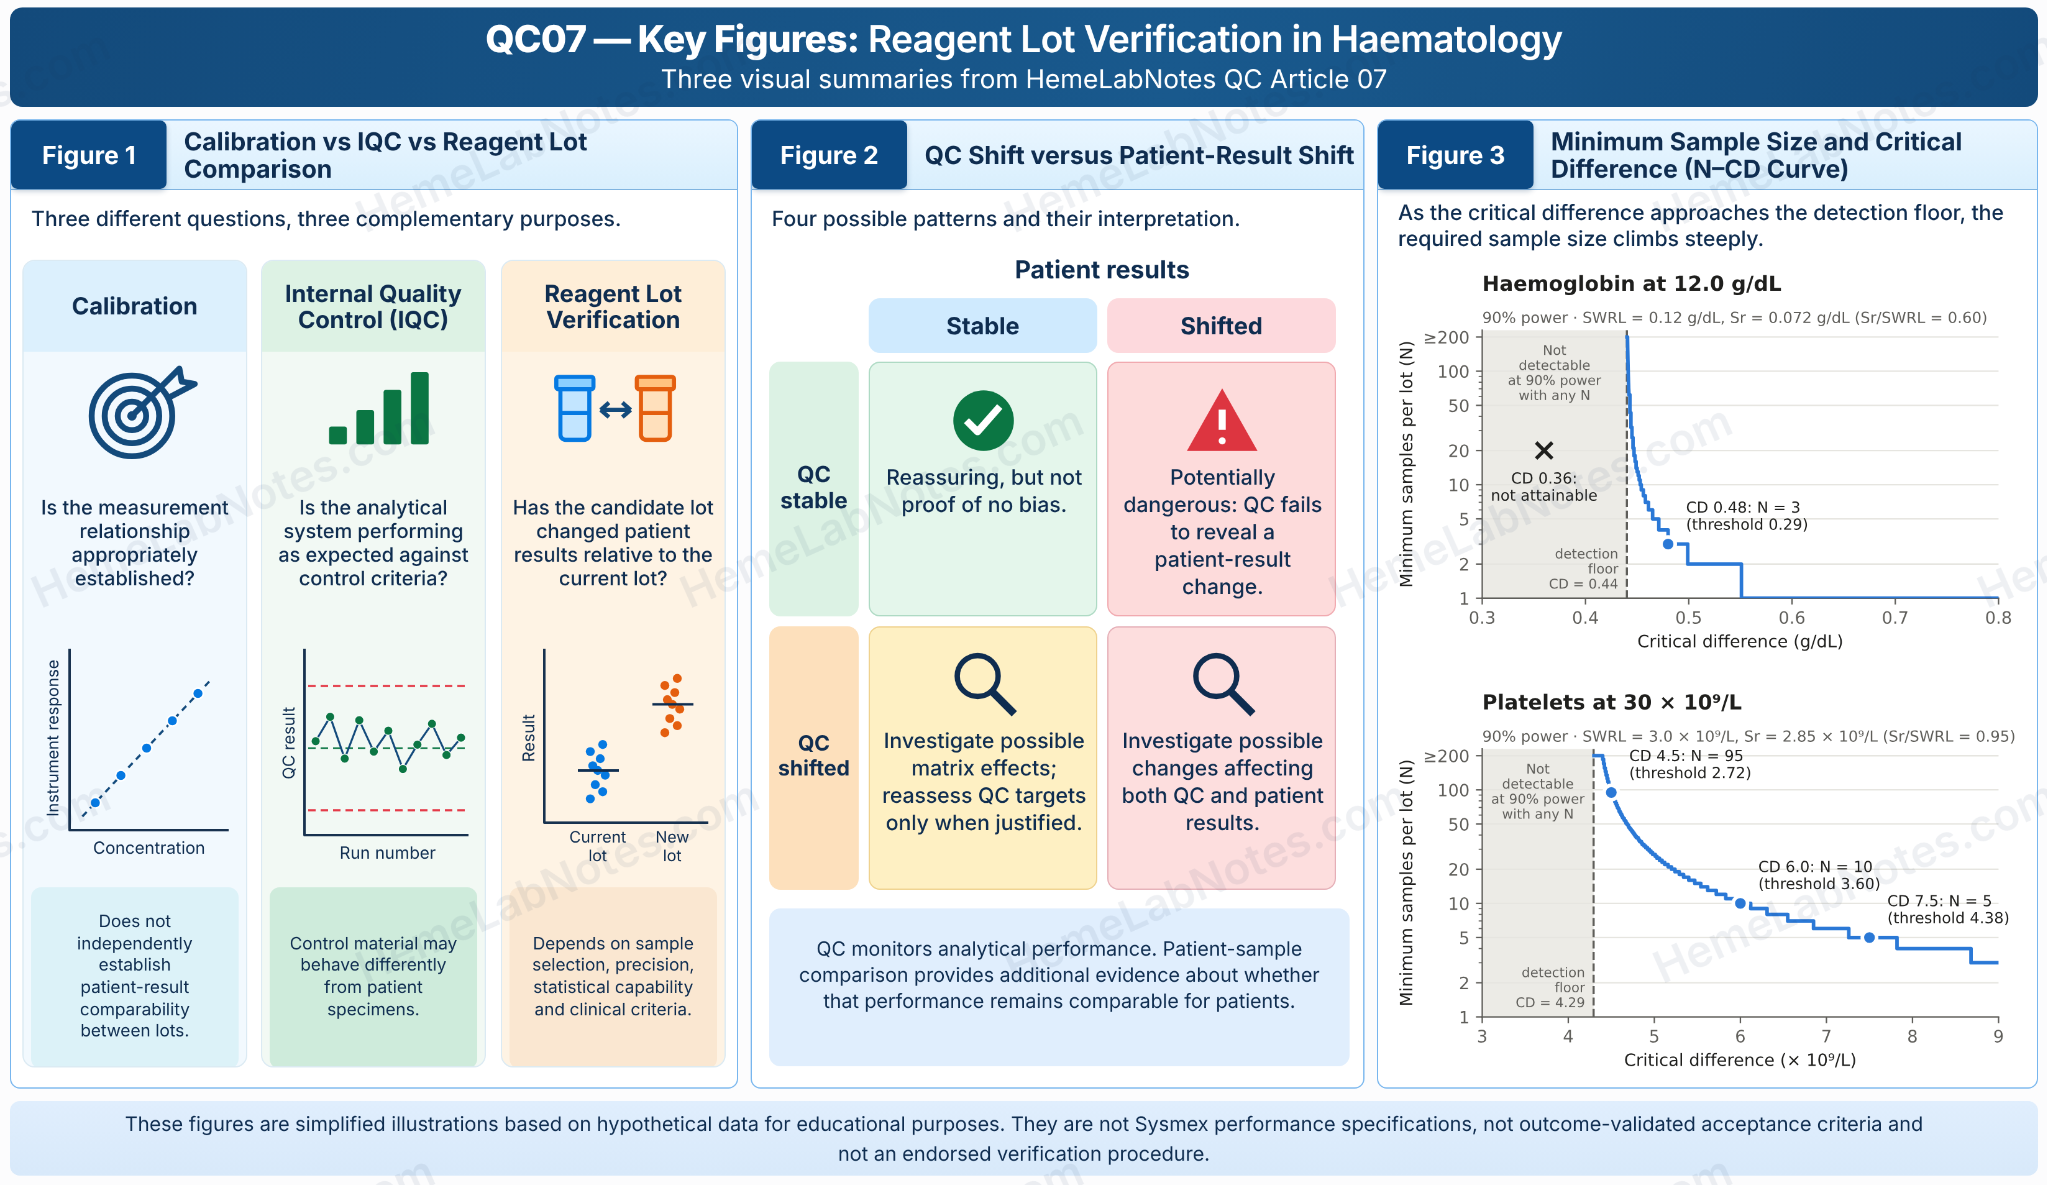
Figures 1–3. Three complementary views of reagent lot verification: Figure 1, Calibration vs IQC vs Reagent Lot Comparison; Figure 2, QC Shift versus Patient-Result Shift; and Figure 3, Minimum Sample Size and Critical Difference (N–CD Curve). The Figure 3 y-axis is logarithmic, and its curve represents the mathematical minimum N under an illustrative model, without applying an illustrative local minimum of three samples.
View full size3. Why QC Alone Cannot Clear a New Lot
One of the most important limitations of routine control materials is that they may not be fully commutable with native patient specimens.
Commutability concerns whether a reference or control material behaves sufficiently like clinical specimens when measured using the analytical procedures being compared.
Commercial QC materials may undergo processing, stabilisation or preservation that changes their matrix. Consequently, a reagent change may affect the QC material and patient samples differently.
Four patterns are possible.
| Patient results stable | Patient results shifted | |
|---|---|---|
| QC stable | Reassuring, but not proof of no bias | Potentially dangerous: QC fails to reveal a patient-result change |
| QC shifted | Investigate possible matrix effects; reassess QC targets only when justified | Investigate possible changes affecting both QC and patient results |
The most concerning situation is when QC remains stable while patient results shift.
The laboratory may continue releasing apparently acceptable QC runs while unknowingly introducing an analytical difference into patient testing.
The opposite situation also matters. If QC shifts but native patient samples remain comparable, the control material may have responded differently to the new reagent. This could justify reassessing the QC target after investigation, but it should not trigger automatic target adjustment.
When both QC and patient results change, investigation is required. However, the presence of both changes does not, by itself, establish that the new reagent lot is clinically unacceptable.
The interpretation depends on the magnitude of the difference, analytical uncertainty, clinical requirements and supporting evidence.
Thompson and Chesher discuss the practical importance of noncommutable control materials in lot-to-lot evaluation [2]. Their review reinforces why patient specimens are valuable when assessing the clinical consequences of a reagent change.
QC monitors analytical performance. Patient-sample comparison provides additional evidence about whether that performance remains comparable for patients.
See Figure 2 in the Key Figures above.
4. Setting the Critical Difference — Clinical Need Before Statistical Convenience
Before deciding how many patient samples to compare, the laboratory must determine what magnitude of reagent-related change matters.
We will refer to this magnitude as the Critical Difference (CD).
A CD should reflect an independently justified analytical or clinical requirement. It should not be chosen simply because a wider difference produces a smaller sample-size requirement.
Three broad approaches can contribute to analytical performance specifications:
Clinical outcome or decision-based specifications. These consider how analytical differences may affect clinical classifications, treatment decisions or patient outcomes.
Biological variation-based specifications. These use within-subject and between-subject biological variation to inform analytical performance requirements.
State-of-the-art specifications. These consider achievable analytical performance, including suitably interpreted external quality-assessment evidence.
The Milan consensus framework recognises these as distinct approaches [3]. They are not automatically interchangeable.
For example, WHO’s 2024 guidance identifies haemoglobin below 12.0 g/dL as an anaemia threshold for non-pregnant women aged 15–65 years [4].
NICE NG24 recommends offering platelet transfusions to patients with clinically significant WHO grade 2 bleeding when platelet counts are below 30 × 10⁹/L [5].
These are meaningful clinical contexts, but neither threshold automatically provides an acceptable reagent lot CD.
To determine how much analytical change can be tolerated around a clinical threshold, additional evidence is needed concerning classification errors, clinical consequences and measurement uncertainty.
Biological variation-based analytical performance specifications
Biological variation provides one scientific approach to analytical performance specifications. The EFLM Biological Variation Database documents within-subject and between-subject variation, alongside its supporting evidence [6]. Readers should consult the original database directly for current values and applicability.
A biological variation-based specification is not automatically a clinically validated critical difference for reagent lot comparison. Clinical context, analytical capability and the consequences of misclassification require separate evaluation.
The following Hb and platelet examples instead use independent hypothetical inputs to explain the relationship between statistical detection capability and the size of a change.
An additional limitation is that biological variation estimates derived from generally healthy populations may not adequately represent severely thrombocytopenic patients.
An important problem emerges when the analytical system cannot reliably detect a change as small as the clinical or analytical requirement.
The solution is not to make the CD wider simply to reduce the number of samples.
Instead, the laboratory must recognise the limitation of its current comparison method and consider whether improved precision, a different study design or additional evidence is required.
5. Understanding Sr, SWRL and the Detection Limit
The ability to detect a reagent-related change depends on analytical imprecision.
Two components are particularly useful for understanding this limitation.
Sr — Within-run repeatability
Sr describes short-term variation when measurements are repeated under defined repeatability conditions.
SWRL — Within-reagent-lot imprecision
SWRL represents longer-term variation associated with measurements performed using the same reagent lot under the specified study conditions. It may include sources of variation that are not apparent during a short repeatability experiment.
SWRL is not simply another name for Sr, and the two quantities should not be assumed equal.
Why adding samples does not always solve the problem
Consider an illustrative design in which the same patient specimens are measured once with each reagent lot, with a shared run-level effect for each lot.
The assumed standard error of the mean difference is:
SE(N) = √[2(SWRL² − Sr²) + 2Sr²/N]
Here, N is the number of independent patient specimens.
The term containing 2Sr²/N decreases as N increases.
The shared run-level component does not.
As a result, collecting more specimens becomes progressively less effective at reducing the uncertainty of the lot comparison.
For a simplified two-sided normal model with a 5% significance level:
T(N) = 1.960 SE(N)
The illustrative study is designed to have at least 90% probability of flagging a true difference equal to the specified CD.
At approximately the required detection probability:
CD ≈ (1.960 + 1.282) SE(N)
T/CD ≈ 1.960/(1.960 + 1.282) ≈ 0.605
This explains why a decision threshold may naturally be expressed as a fraction of the change the study is designed to detect.
The ratio is approximate rather than universal. It changes with statistical assumptions, power targets, study design and integer sample sizes.
A statistical flag is not a clinical verdict
The 5% significance level is the probability of a flag when the true lot difference is exactly zero. A clinically acceptable difference, however, is rarely zero.
A true shift smaller than the CD can still trigger a flag. In the haemoglobin example in Section 7 (N = 4, CD 0.48 g/dL), a true shift of 0.25 g/dL, about half the CD, is flagged 40.7% of the time.
A statistical flag is evidence of a possible non-zero lot difference, not automatic evidence that the clinically acceptable difference has been exceeded. This is why the lot acceptance decision must remain separate from the statistical test itself.
The detection floor
As N increases without limit, the repeatability contribution approaches zero, but the shared run-level component remains.
The approximate minimum detectable change at 90% power is:
CDmin ≈ 3.242 √[2(SWRL² − Sr²)]
This is the detection floor of the illustrative model.
A proposed CD below that floor cannot be detected with the specified 90% probability by increasing N alone.
This does not represent a universal limitation of reagent lot verification. It applies only to the stated statistical model and assumptions.
CLSI EP26 provides established guidance for developing reagent lot verification schemes, with its own design and selection approach [7]. The independent calculations in this article are not reproductions of that procedure and must not be substituted for a laboratory’s authorised verification method.
6. Haematology Realities — What Makes Reagent Changes Different?
Although reagent lot variation is discussed extensively in clinical chemistry, haematology introduces several additional practical considerations.
Comparison schemes of this kind are intended for quantitative measurements in which a new reagent lot is not expected to shift results. CLSI EP26, for example, excludes procedures such as prothrombin time and activated partial thromboplastin time, where lot-related shifts are expected and handled through other processes [7]. This article therefore focuses on quantitative CBC measurements.
Different reagents affect different analytical pathways
On Sysmex XR/XN-class analysers, routine haematology measurements may involve impedance, fluorescence flow cytometry and SLS haemoglobin methodology [8].
For example, reagent systems used in RBC/impedance platelet measurements are not necessarily the same as those used for WBC differential analysis or fluorescence-based platelet counting.
A reagent change should therefore lead the laboratory to consider the relevant measurement channels, directly measured parameters and dependent calculated parameters.
The precise reagent-to-parameter mapping must be confirmed against the manufacturer’s current Instructions for Use for the analyser configuration involved.
A verification assessment designed around the wrong parameter group may overlook the measurement pathway most likely to be affected.
Whole-blood stability matters
Unlike many chemistry specimens, fresh EDTA whole blood has important time- and storage-dependent limitations.
Platelet behaviour, cellular volume and certain derived indices may change during storage. These changes can complicate interpretation when comparing two lots.
Using an aged specimen may introduce a difference unrelated to reagent performance.
Likewise, a frozen specimen pool cannot automatically be assumed suitable for routine haematology lot comparison.
The required specimen stability must be established for the specific measurand, temperature and time interval.
Avoid confusing module differences with reagent differences
Comparing the current lot on one analytical module and the candidate lot on another can introduce an additional source of variation.
Any observed difference might reflect the reagent lot, the analyser module, or both.
Where operationally feasible, using the same module for both lots helps reduce this confounding. If this is not possible, the laboratory needs a validated design that separately accounts for module-related effects.
The design must also consider run order, reagent switching, sample age and mixing conditions.
Low platelet counts are a special challenge
Analytical imprecision can be strongly concentration dependent.
A precision estimate obtained from normal platelet counts may not adequately describe performance at 20–40 × 10⁹/L.
Low-count platelet verification therefore requires special attention to the analytical method, relevant measurement range, interference and clinical context.
For analysers offering different platelet measurement channels, such as impedance and fluorescence methods, results must be interpreted according to the channel and corresponding validated precision characteristics.
A statistically correct design can still be clinically unsuitable if its samples, analytical pathway or precision assumptions do not represent the intended patient population.
7. Worked Examples — When Sample Size Becomes Impractical
The following examples use hypothetical values designed solely to demonstrate statistical principles.
They are not Sysmex performance specifications, not outcome-validated CDs and not formal reagent lot acceptance procedures.
Example A — Haemoglobin
Assume:
-
Target Hb: 12.0 g/dL
-
Sr: 0.072 g/dL
-
SWRL: 0.120 g/dL
-
Candidate CDs: 0.36 and 0.48 g/dL
-
Two-sided significance level: 5%
-
Target detection probability: 90%
Under the independent statistical model, the approximate detection floor is 0.44 g/dL.
If the clinically required CD were 0.36 g/dL, the model could not achieve 90% detection probability with any finite sample size.
At an illustrative CD of 0.48 g/dL, the minimum calculated sample size is three.
For the practical teaching comparison, four samples are used: one above the calculated minimum, as a teaching choice, with power re-evaluated at N = 4.
| Hb comparison | Candidate A | Candidate B |
|---|---|---|
| N | 4 | 4 |
| Mean new − current | +0.175 g/dL | +0.325 g/dL |
| Statistical threshold | ±0.284 g/dL | ±0.284 g/dL |
| Outcome | No statistical flag | Investigation indicated |
At N = 4, the model provides approximately 91.16% power to flag a true shift of 0.48 g/dL.
Candidate A does not produce a statistical flag. Candidate B exceeds the statistical threshold and requires investigation.
These are statistical findings, not complete clinical acceptance decisions.
Importantly, the flagged difference does not automatically demonstrate that the clinically important CD has been exceeded.
Example B — Low platelet count
Now assume:
-
Target PLT: 30 × 10⁹/L
-
Sr: 2.85 × 10⁹/L
-
SWRL: 3.00 × 10⁹/L
-
Candidate CDs: 4.5, 6.0 and 7.5 × 10⁹/L
-
Two-sided significance level: 5%
-
Target detection probability: 90%
The approximate detection floor is 4.29 × 10⁹/L.
The effect on sample size is striking.
| Hypothetical CD | Calculated minimum N |
|---|---|
| 4.5 × 10⁹/L | 95 |
| 6.0 × 10⁹/L | 10 |
| 7.5 × 10⁹/L | 5 |
When the CD is only slightly above the detection floor, the sample requirement becomes very large.
Obtaining 95 suitable fresh whole-blood specimens in the required concentration interval may be impractical.
This limitation does not justify widening the CD without clinical evidence.
For the teaching comparison with CD = 6.0 × 10⁹/L, eleven samples are used: again one above the calculated minimum, with power re-evaluated at N = 11.
| PLT comparison | Candidate A | Candidate B |
|---|---|---|
| N | 11 | 11 |
| Mean new − current | +2.00 × 10⁹/L | −4.09 × 10⁹/L |
| Statistical threshold | ±3.52 × 10⁹/L | ±3.52 × 10⁹/L |
| Outcome | No statistical flag | Investigation indicated |
At N = 11, the detection probability for a true shift of 6.0 × 10⁹/L is approximately 91.58%.
The negative difference in Candidate B illustrates why lot comparison must consider shifts in both directions.
How likely is a flag, and how large could the shift be?
A flag becomes likely well before a shift reaches the CD. The table shows the model’s probability of a statistical flag for different true shifts.
| True Hb shift (g/dL), N = 4 | Probability of flag | True PLT shift (× 10⁹/L), N = 11 | Probability of flag |
|---|---|---|---|
| 0 | 5.0% | 0 | 5.0% |
| 0.10 | 10.6% | 2.0 | 19.9% |
| 0.25 | 40.7% | 3.0 | 38.6% |
| 0.36 | 69.9% | 4.5 | 70.7% |
| 0.48 (CD) | 91.2% | 6.0 (CD) | 91.6% |
Reporting each mean difference with its confidence interval turns the question from “was there a flag?” into “how large could the shift be?”.
| Candidate | Mean difference | 95% CI | 90% CI | Interpretation |
|---|---|---|---|---|
| Hb A | +0.175 g/dL | −0.11 to 0.46 | −0.06 to 0.41 | 90% CI within ±0.48 |
| Hb B | +0.325 g/dL | 0.04 to 0.61 | 0.09 to 0.56 | A shift as large as the CD cannot be excluded |
| PLT A | +2.00 × 10⁹/L | −1.52 to 5.52 | −0.96 to 4.96 | 90% CI within ±6.0 |
| PLT B | −4.09 × 10⁹/L | −7.61 to −0.57 | −7.05 to −1.13 | A shift as large as the CD cannot be excluded |
For both Candidate B scenarios, the 95% confidence interval includes the hypothetical boundary in the direction of the observed shift (+CD for Hb and −CD for PLT). A shift of that magnitude cannot be excluded; the statistical flag does not establish that it occurred.
Detection power is not proof of equivalence
A negative statistical finding does not establish that two reagent lots are equivalent.
However, under the assumptions of a study designed for 90% power at a prespecified CD, a true shift of that magnitude has approximately a 90% probability of being flagged.
This is meaningful evidence about the study’s ability to detect a specified change, but it is not proof that smaller differences are absent.
A formal equivalence claim requires an appropriately designed equivalence analysis, such as the two one-sided tests (TOST) approach, with a justified equivalence margin.
The required sample size depends on the chosen margin, analytical precision and study design.
Under the model’s known-precision assumption, a 90% confidence interval lying entirely within ±CD corresponds to passing TOST at that margin, as both A candidates do. Because these comparisons were not designed as equivalence studies, this illustrates the principle rather than making a prespecified equivalence claim.
See Figure 3 in the Key Figures above.
8. When a Comparison Raises Concern — Investigation, Decision and Cumulative Drift
A comparison that raises a statistical flag should lead to investigation, not automatic rejection and not repeated testing until a satisfactory result appears.
The investigation should consider potential pre-analytical, analytical and administrative causes.
Relevant questions include whether specimens remained stable, whether both lots were assessed on comparable analytical conditions, whether the correct reagent and measurement channel were involved, and whether sample or result transcription errors occurred.
QC performance, calibration status, manufacturer information and other available analytical evidence may contribute to the assessment. The confidence interval of the mean difference (Section 7) helps judge whether the shift could be large enough to matter clinically.
Any repeat testing must follow a prespecified, approved procedure that considers the consequences of repeated testing for the overall decision risks.
A comparison without a statistical flag is also not sufficient to authorise clinical release.
Before implementation, the laboratory must complete the applicable quality-control checks, manufacturer requirements and clinical acceptance review under its authorised SOP.
The cumulative drift problem
An additional concern is that multiple reagent lot changes may produce gradual changes in analytical performance over time.
Consider a sequence of lots in which each transition produces a small difference from the preceding lot.
Each individual comparison may appear satisfactory, but repeated small shifts in the same direction can accumulate.
The analytical system may eventually produce results that differ meaningfully from those obtained several lots earlier.
This is one reason a passing comparison cannot be interpreted as proof of zero bias.
Liu and colleagues demonstrated the limitations of routine lot comparisons for detecting long-term cumulative analytical drift and explored alternative statistical approaches [9].
Cumulative drift may escape both a single new-versus-current comparison and short-term QC. Keeping a long-term baseline is therefore a valuable complement: reviewing QC trends across successive reagent lots while the QC material lot is unchanged, patient-based moving averages, and external quality assessment or peer data.
These findings provide an important connection to the earlier HemeLabNotes articles on drift monitoring and patient-based quality control.
QC05 discusses how persistent analytical changes may emerge over time, while QC06 considers the contribution and limitations of patient-based monitoring approaches.
These methods can provide complementary information, although none independently eliminates the need for appropriate analytical investigation.
A new reagent lot may be acceptable relative to the preceding lot while the measurement process is gradually moving away from its earlier baseline.
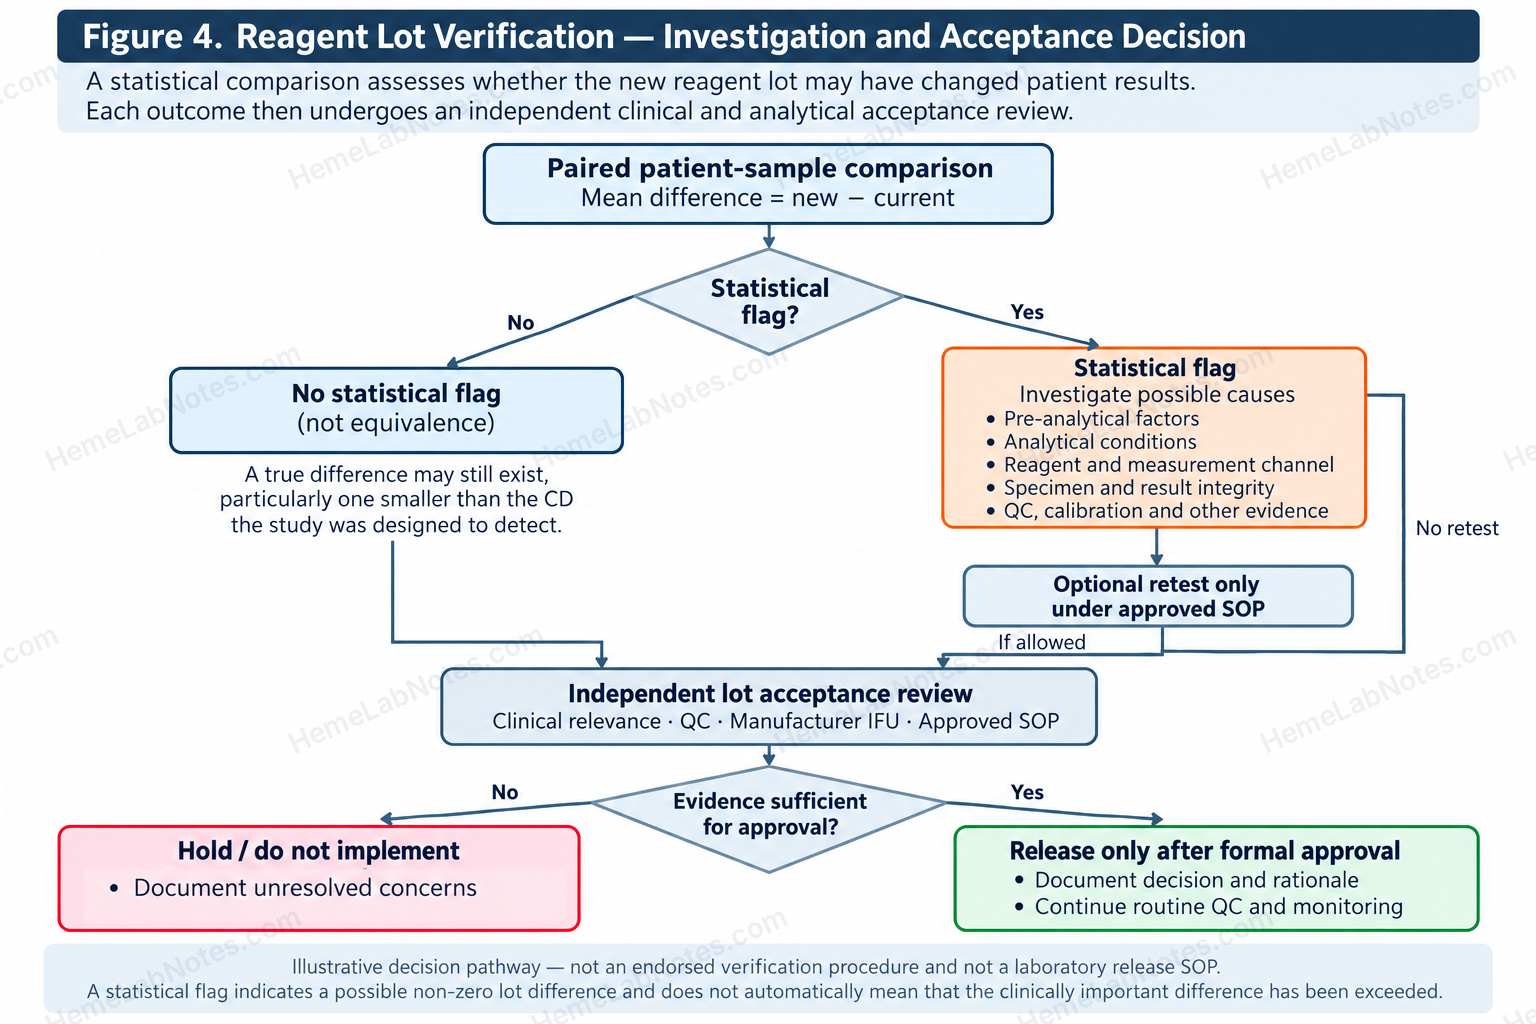
Figure 4. Illustrative reagent lot comparison, investigation and independent acceptance pathway. Neither a statistical flag nor the absence of one automatically determines clinical release; the decision requires an approved laboratory review.
View full size9. Practical Takeaways and References
Reagent lot verification is ultimately a patient-safety activity.
The calculations are important, but they are only one part of the decision.
A laboratory must understand the clinical significance of an analytical difference, the precision of its measurement process, the suitability of the patient specimens and the limitations of the statistical comparison.
The essential points are:
-
Passing QC does not establish that patient results are unchanged. Control materials may not respond like native patient specimens.
-
The clinically important difference must be justified before sample-size calculations. A wider CD cannot be selected merely for convenience.
-
Sr and SWRL describe different components of imprecision. Increasing N may reduce some uncertainty without eliminating shared run-level variation.
-
A study with sufficient detection power does not automatically establish clinical equivalence. A result without a statistical flag is not proof of zero bias.
-
A statistical flag is not the same as exceeding the CD. It shows a possible non-zero difference; the investigation must judge its size against clinical requirements.
-
Haematology requires attention to specimen stability, concentration-dependent precision, analytical channels and module effects.
-
A flagged comparison requires investigation. Retesting and lot release must be governed by an approved procedure.
-
A passing lot comparison does not exclude cumulative analytical drift. Longitudinal QC and patient-based monitoring provide additional perspectives.
The question is not simply whether the new reagent lot passed a statistical check.
The more important question is whether the laboratory has sufficient, clinically relevant evidence that introducing the lot will preserve reliable patient results.
References
-
Loh TP, Markus C, Tan CH, Tran MTC, Sethi SK, Lim CY. Lot-to-lot variation and verification. Clin Chem Lab Med. 2023;61(5):769–776. doi:10.1515/cclm-2022-1126.
-
Thompson S, Chesher D. Lot-to-Lot Variation. Clin Biochem Rev. 2018;39(2):51–60. PMID: 30473592. PMC6223607
-
Sandberg S, Fraser CG, Horvath AR, et al. Defining analytical performance specifications: consensus statement from the 1st Strategic Conference of the European Federation of Clinical Chemistry and Laboratory Medicine. Clin Chem Lab Med. 2015;53(6):833–835. doi:10.1515/cclm-2015-0067.
-
World Health Organization. Guideline on haemoglobin cutoffs to define anaemia in individuals and populations. Geneva: WHO; 2024.
-
National Institute for Health and Care Excellence. Blood transfusion. NICE guideline NG24. Platelet transfusion recommendations.
-
European Federation of Clinical Chemistry and Laboratory Medicine. EFLM Biological Variation Database. Haemoglobin and thrombocyte meta-analysis entries. Accessed October 2026.
-
Clinical and Laboratory Standards Institute. User Evaluation of Acceptability of a Reagent Lot Change. 2nd ed. CLSI guideline EP26. 2022. Reaffirmed July 2026.
-
Sysmex Europe. Complete blood count application (CBC). Knowledge Centre.
-
Liu J, Tan CH, Loh TP, Badrick T. Detecting long-term drift in reagent lots. Clin Chem. 2015;61(10):1292–1298. doi:10.1373/clinchem.2015.242511.