The morning QC has passed.
All three control levels are acceptable, and the analyser is processing patient samples without any obvious problems.
Later in the day, however, the patient MCV moving average begins to rise.
The commercial MCV control remains stable.
So which result should we trust?
Perhaps the analyser has developed a small analytical change that the commercial control has not detected. Perhaps the patients being tested are different from those processed earlier.
Or perhaps the moving-average system is behaving exactly as expected.
The important point is that a patient moving average is not a diagnosis of an analyser problem. It is another source of information that can help us decide whether something needs investigating.
1. Why Look Beyond Commercial QC?
Commercial quality-control materials are designed to provide stable measurements against established targets.
They are essential for monitoring analytical performance. However, they are not identical to fresh patient blood, and their behaviour may differ from that of routine clinical specimens.
Patient-based quality control approaches the problem from another direction.
Instead of measuring a separate control material, it examines patterns in the results already being produced by the laboratory.
This offers an important practical advantage: analytical performance can be monitored throughout routine patient testing, including the intervals between scheduled commercial QC measurements.
But patient-based monitoring introduces a different problem.
Unlike control materials, patient results are not expected to remain individually stable. A patient with iron deficiency may have a low MCV, while another patient with macrocytosis may have a much higher result.
Neither finding suggests that the analyser is malfunctioning.
The useful information comes from the behaviour of an appropriately selected group of patient results over time.
Commercial QC asks whether control material behaves as expected. Patient-based QC asks whether the pattern of patient measurements remains consistent with the laboratory’s validated expectations.
Both questions matter.
2. From Bull’s X̄B to Patient Moving Averages
The concept of using patient results for quality control is not new.
In 1974, Bull and colleagues described statistical approaches to monitoring haematology analysers through patient erythrocyte indices. [1]
The work became closely associated with Bull’s X̄B algorithm.
Two features help distinguish the classical approach from a simple arithmetic moving average.
Batch-based calculation
Patient results are collected into groups, classically batches of 20.
Rather than producing a new plotted point after every patient result, the method generates a new estimate from each completed batch.
Reduced influence of outlying results
Bull’s algorithm uses a nonlinear calculation that reduces the influence of results far from the previous estimate.
A small number of unusually high or low patient values therefore has less influence than it would have on a simple arithmetic mean.
This does not eliminate population effects, but it helps limit the influence of individual extremes.
The traditional application focuses on three red-cell indices:
- MCV — Mean Corpuscular Volume
- MCH — Mean Corpuscular Haemoglobin
- MCHC — Mean Corpuscular Haemoglobin Concentration
Why these parameters?
Across a sufficiently large and reasonably consistent patient population, their aggregate behaviour may be relatively stable compared with individual patient measurements.
That makes them useful candidates for detecting systematic analytical changes.
However, the stability is not guaranteed.
In an evaluation of Bull’s algorithm, Cembrowski and Westgard demonstrated that error-detection performance depended on the magnitude of the analytical shift and the composition of the patient population. [2]
The method could detect sufficiently large systematic errors, but smaller changes were more difficult to recognise.
Patient-based quality control has since developed beyond the original approach.
Modern methods include different moving-average algorithms, weighted calculations, and other statistical techniques that use routine patient results to monitor analytical performance. [3]
The underlying idea remains the same.
Rather than looking only at individual patient results, the laboratory examines how selected results behave collectively over time.
The challenge is deciding whether a change reflects the analytical process or the patients being tested.
3. How Does a Moving Average Work?
Imagine that the laboratory has obtained five patient MCV results:
86, 88, 90, 87 and 89 fL.
Their simple arithmetic mean is:
(86 + 88 + 90 + 87 + 89) / 5 = 88.0 fL
Now five more patients arrive.
There are two ways we can illustrate how the average is updated.
Rolling window
In a rolling window of five results, the oldest value is removed and the newest is included every time another patient result becomes available.
The mean is recalculated after each new result.
Batch-based calculation
In a non-overlapping batch approach, the laboratory collects the next five eligible results before calculating another mean.
This resembles the batch-update timing of classical Bull’s X̄B, although the calculation itself is different.
| Patient | MCV (fL) | Rolling mean, last 5 (fL) | Batch mean (fL) |
|---|---|---|---|
| 1–5 | 86, 88, 90, 87, 89 | 88.0 | 88.0 (Batch 1) |
| 6 | 92 | 89.2 | — |
| 7 | 85 | 88.6 | — |
| 8 | 88 | 88.2 | — |
| 9 | 90 | 88.8 | — |
| 10 | 91 | 89.2 | 89.2 (Batch 2) |
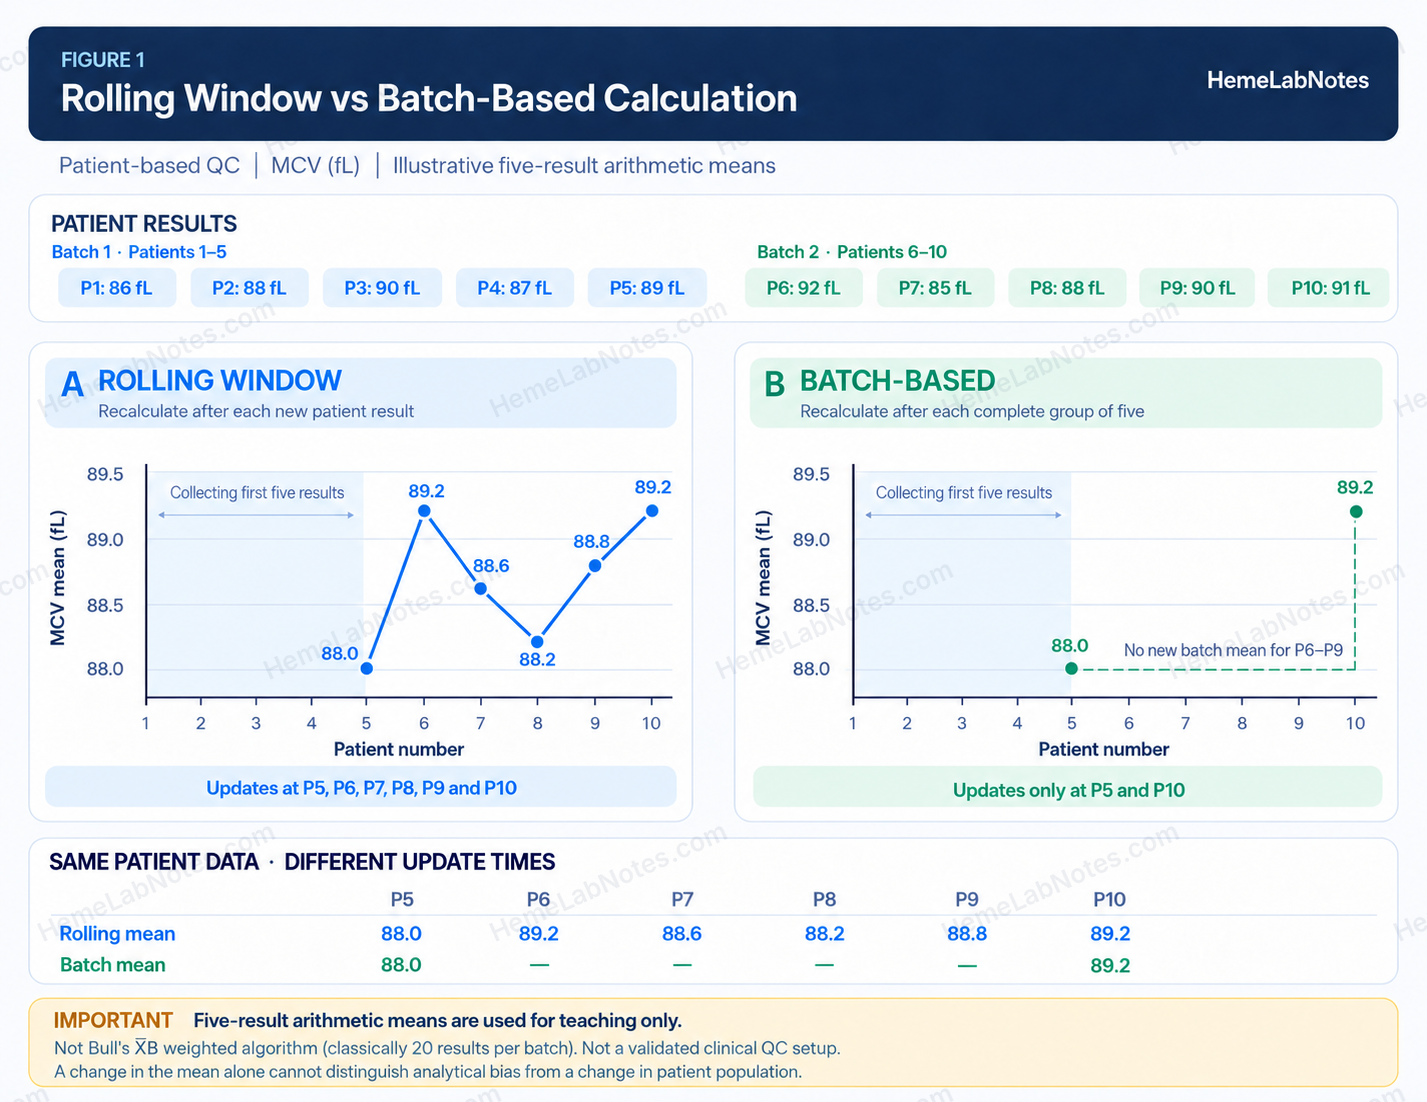
Figure 1. Rolling Window vs Batch-Based Calculation.
View full sizeThe rolling mean was updated five times, rising and falling as different patient results entered the calculation.
The batch mean was updated only when the second group of five results was complete.
Has the analyser developed an analytical bias?
Not necessarily.
Every change in this example occurred because the calculation included a different group of patient results.
This is the fundamental challenge of patient-based monitoring: a changing average may reflect analytical change, patient population change, or ordinary statistical variation.
Illustrative calculation only. A five-result simple mean is not a recommended clinical configuration. Neither calculation reproduces the nonlinear weighting used in Bull’s X̄B.
Actual patient-based QC methods may use different window or batch sizes, weighted calculations, selection criteria and locally established control limits.
Their settings must be optimised and verified for the laboratory in which they will operate. [3–5]
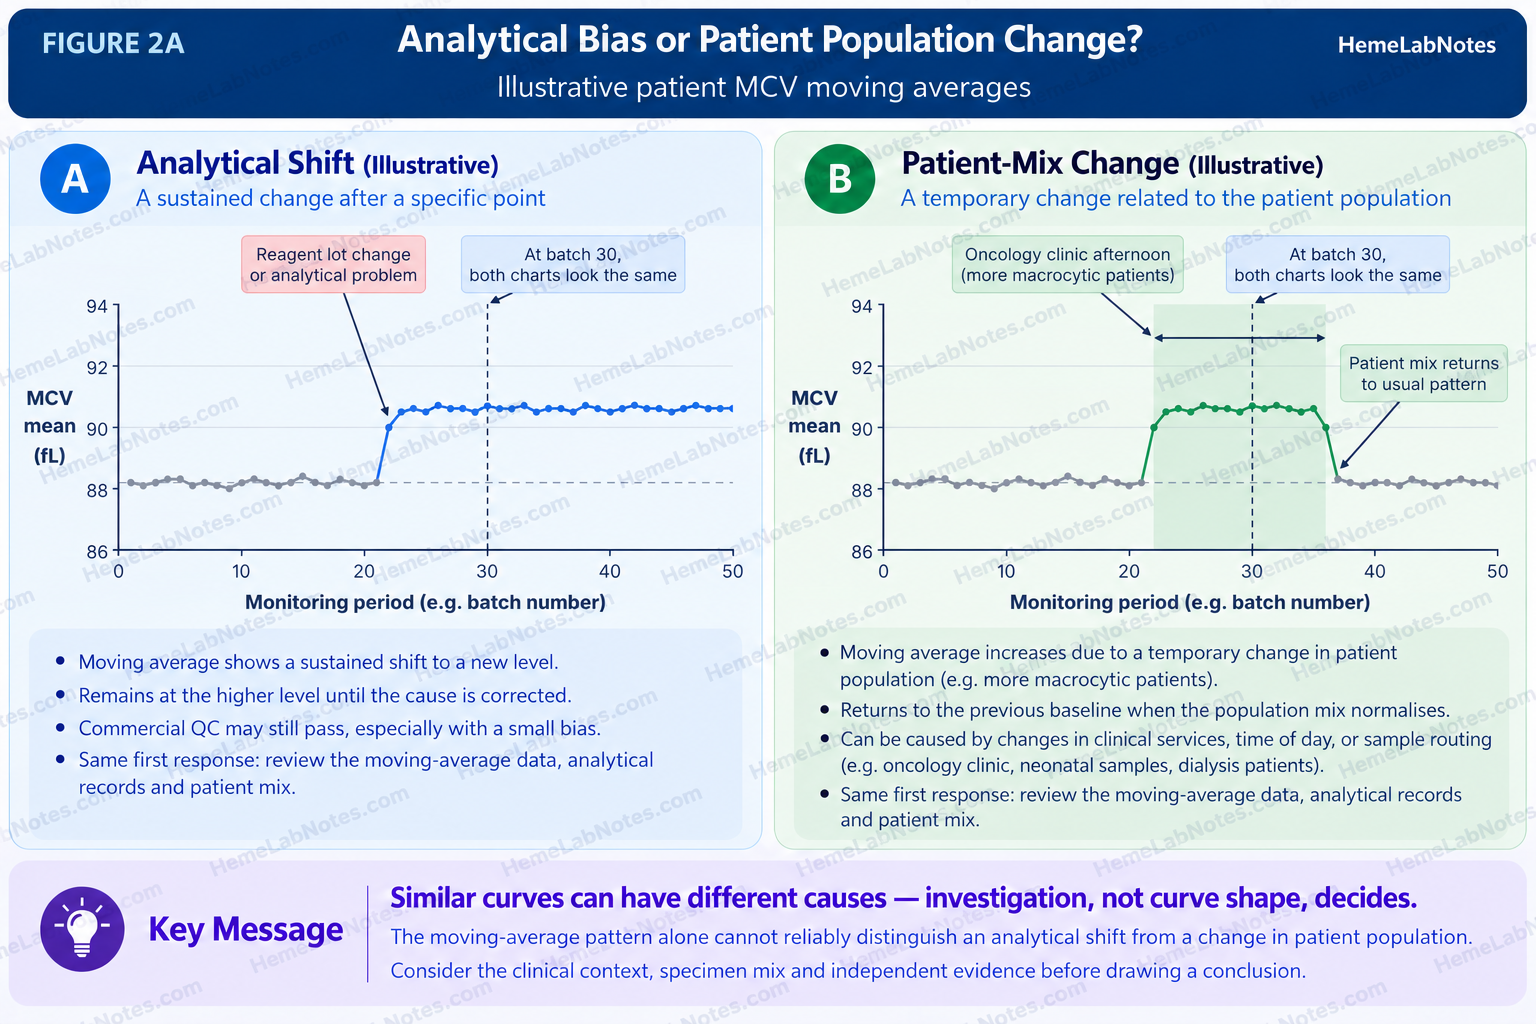
Figure 2A. Analytical Bias or Patient Population Change?
View full size4. Which Haematology Parameters Are Useful?
Not every CBC parameter behaves equally well in patient-based monitoring.
MCV, MCH and MCHC
These red-cell indices have traditionally been useful because their population distributions can remain relatively consistent when the patient mix is stable.
MCHC in particular has a relatively narrow distribution in many patient populations, making systematic changes potentially easier to recognise.
However, interpreting a moving-average change requires more than knowing whether a parameter has increased or decreased.
We also need to understand which values the analyser measures and which it calculates.
Measured versus calculated: the Sysmex approach
Different haematology analysers may derive their red-cell parameters through different measurement pathways.
On Sysmex haematology analysers using hydrodynamically focused impedance, the RBC count is obtained from detected cell pulses.
HCT is determined by accumulating information from the RBC pulses, including their number and heights.
HGB is measured using the SLS haemoglobin method.
MCV, MCH and MCHC are calculated from the corresponding measurements. [6,7]
| Index | Calculation | Uses HCT? |
|---|---|---|
| MCV (fL) | HCT (%) × 10 / RBC (10¹²/L) | Yes |
| MCH (pg) | HGB (g/dL) × 10 / RBC (10¹²/L) | No |
| MCHC (g/dL) | HGB (g/dL) × 100 / HCT (%) | Yes |
These relationships have a practical consequence.
When one underlying measurement changes, the calculated indices may move in a recognisable pattern.
Reading the red-cell fingerprint
Consider two simplified situations in which one measurement changes while the others remain approximately stable.
| Simplified measurement change | MCV | MCH | MCHC |
|---|---|---|---|
| Cell sizing reads high (HCT ↑, RBC unchanged) | ↑ | — | ↓ |
| HGB measurement reads high (RBC and HCT unchanged) | — | ↑ | ↑ |
| Patient population change | No fixed pattern | No fixed pattern | No fixed pattern |
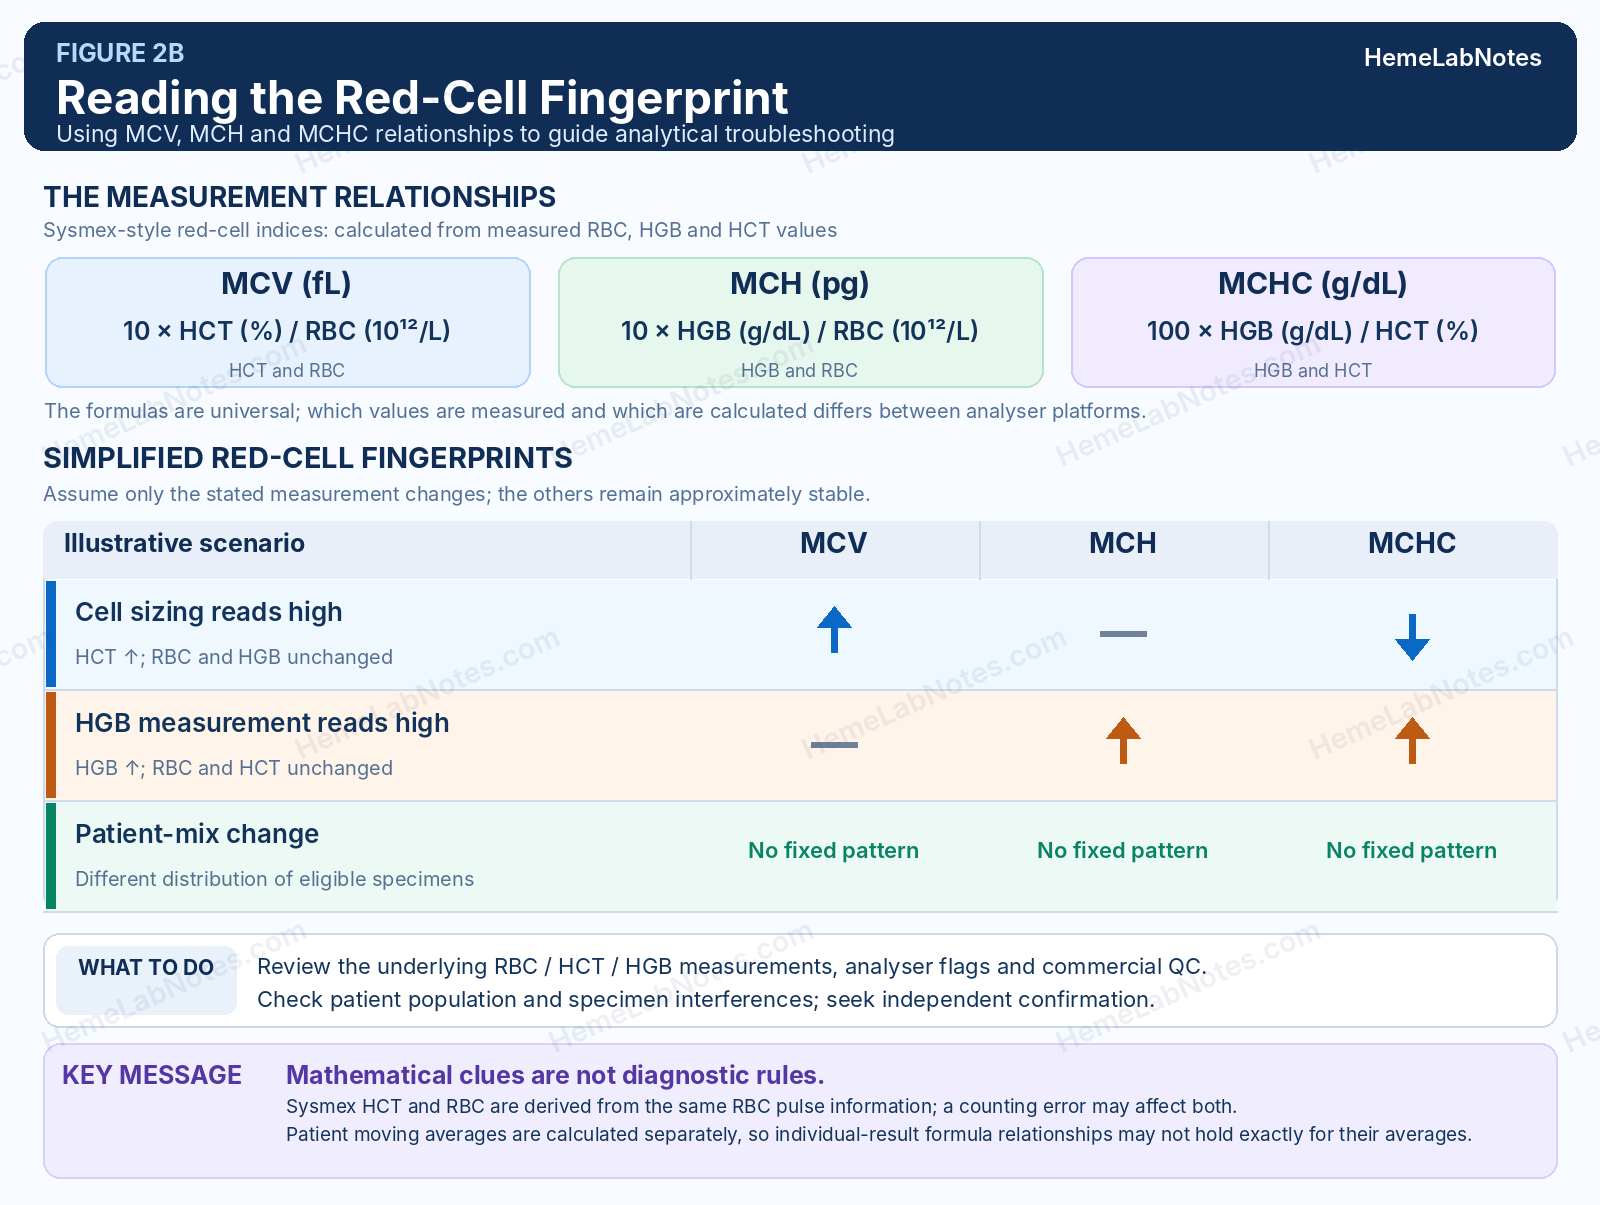
Figure 2B. Reading the Red-Cell Fingerprint.
View full sizeThese are mathematical consequences of the calculation relationships, not diagnostic rules.
On Sysmex analysers, HCT is derived from the same RBC pulses used for counting. A counting-related error may therefore affect both RBC and HCT.
The resulting pattern depends partly on the number and size of the pulses included in the measurements.
An isolated RBC counting error with completely unchanged HCT should therefore not be treated as a typical Sysmex troubleshooting pattern.
Now imagine that the patient MCV moving average is rising, MCHC is falling, and MCH remains relatively stable.
This combination is consistent with a change involving HCT relative to RBC and HGB.
It suggests that cell sizing and the underlying measurement relationships deserve closer examination.
But it does not establish that the HCT measurement pathway is faulty.
A real analytical problem may affect several measurements simultaneously. A fluidic disturbance, counting problem or specimen-related interference may produce a more complicated pattern.
There is another limitation.
MCV, MCH and MCHC moving averages are calculated separately from selected patient results. Their population averages do not necessarily preserve the exact mathematical relationships of individual patient indices.
The fingerprint therefore helps guide investigation; it should not be used to reconstruct an underlying analytical error from the three averages alone.
Understanding the analyser’s measurement methodology helps us decide where to investigate, rather than treating every changing parameter as a separate analytical error.
WBC and PLT
WBC and platelet results can vary substantially with the patient population.
A laboratory receiving large numbers of haematology-oncology specimens may have a very different distribution from a community outpatient laboratory.
That does not automatically make WBC or PLT unsuitable for patient-based QC.
It means that their algorithms, selection criteria and control limits may require greater attention.
A parameter should not be considered suitable merely because a monitoring system can calculate its moving average.
The laboratory needs evidence that its monitoring procedure can distinguish meaningful analytical changes from expected patient variation.
5. When the Patient Population Changes
This is one of the most important limitations to understand.
Imagine a laboratory that normally receives a mixture of outpatient and inpatient specimens.
During a particular afternoon, a substantially greater proportion of samples comes from oncology patients.
The MCV distribution may change even though the analyser’s analytical performance has remained stable.
Similar changes may occur when the laboratory processes more neonatal specimens, dialysis patients, or patients from a particular specialty.
Time of day can matter as well.
The first hundred specimens in the morning may not represent the same population as the first hundred specimens processed during an overnight shift.
Which results should be excluded?
Selection criteria determine which results enter the calculation.
Depending on the analyser, algorithm and laboratory population, potential exclusions or special handling considerations include:
- Repeat measurements of the same specimen, to avoid over-representing one patient’s result
- Repeated specimens from the same patient within a short interval, where appropriate
- QC materials, calibrators and EQA specimens processed in patient mode
- Neonatal or cord-blood specimens when monitoring a predominantly adult population
- Specimens with analytical flags indicating unreliable measurements
- Results outside predefined inclusion or truncation limits
These are considerations for method design, not a universal exclusion list.
Some specimen-related interferences deserve particular attention.
Cold agglutinins may produce a falsely decreased RBC count with increased MCV, MCH and MCHC.
Lipaemia, or marked leukocytosis under certain analytical conditions, may cause falsely elevated measured HGB and consequently increased MCH and MCHC.
Another less obvious interference involves abnormal plasma osmolality.
On susceptible measurement systems, marked hyperosmolality may produce falsely increased MCV and HCT, with decreased MCHC.
Severe hyponatraemia may produce the opposite pattern, with falsely decreased MCV and HCT and increased MCHC. [7]
These are specimen-dependent effects rather than evidence of persistent analyser drift.
A concentration of affected specimens during a particular clinical workload could influence patient moving averages.
For a practical discussion of cold agglutination and misleading CBC patterns, see our earlier article, Cold Agglutination on the CBC: When the Numbers Stop Agreeing (Article 14).
However, excluding every abnormal specimen is not necessarily the best solution.
Excessive exclusion can reduce the number of eligible results and delay analytical error detection.
It may also create a monitored population that no longer represents the laboratory’s routine workload.
Exclusion rules must therefore be selected carefully and verified together with the algorithm.
They should not be changed retrospectively simply to make an unexpected moving-average alarm disappear.
Throughput and detection time
A batch of 20 eligible patient results does not represent the same period of time on every shift.
Consider two situations.
| Eligible specimens processed | Time needed to complete 20 results |
|---|---|
| 60 per hour | Approximately 20 minutes |
| 5 per hour | Approximately 4 hours |
The batch size is identical.
The time required to obtain a new monitoring point is not.
During a busy shift, several monitoring points may become available within a short period.
During a quiet overnight shift, the analyser may take hours to complete one batch.
If the algorithm requires several batches before a small analytical change becomes detectable, the delay may become substantial.
This is why the number of patient results required to detect an error and the elapsed time before detection should be considered separately.
Patient selection and sample routing can make the difference even greater.
Before attributing a moving-average change to analytical drift, examine the population being tested and the circumstances under which the results were collected.
6. How Should a Laboratory Establish Patient-Based QC?
Patient-based QC needs more than an algorithm and an attractive graph.
A suitable procedure should be designed, optimised and verified using data relevant to the laboratory’s own testing environment.
A practical development process can be divided into four stages.
Stage 1 — Understand the baseline
Begin with historical patient results collected during periods of acceptable analytical performance.
Review the distributions by parameter, analyser and relevant patient groups.
Look for differences associated with time of day, clinical service, sample routing or other operational conditions.
Also consider whether the baseline data contain analytical shifts that were not recognised at the time.
Historical results should not automatically be regarded as error-free simply because conventional QC passed.
Stage 2 — Select and optimise the method
The laboratory must determine which calculations and selection criteria are appropriate.
Depending on the chosen method, important settings may include:
- Moving-average algorithm
- Window or batch size
- Inclusion and exclusion criteria
- Truncation limits, where justified
- Upper and lower control limits
- Separate monitoring of analytical systems, where appropriate
There is no universally optimal combination.
An overly sensitive procedure may produce frequent false alarms.
A less sensitive procedure may fail to detect clinically important changes early enough.
The objective is not to produce the smoothest possible graph.
It is to develop a monitoring procedure that can identify meaningful analytical changes while maintaining an acceptable false-alarm rate.
Stage 3 — Verify error detection
Historical patient data can be used to evaluate how the algorithm responds to simulated analytical errors.
For example, a defined positive or negative analytical bias can be introduced into a retrospective sequence of patient results.
The monitoring procedure is then evaluated to determine whether the change is detected and how many patient results are processed before an alarm occurs.
The assessment should consider:
- Detection capability at relevant error magnitudes
- Number of patient results affected before detection
- Expected false-alarm frequency
- Effects of patient population changes
- Differences in workload and sample throughput
A method that detects very small changes but repeatedly produces unnecessary alarms may be difficult to use effectively.
Conversely, a quiet chart is not necessarily a good chart if clinically important errors remain undetected.
Where possible, performance should be verified using data separate from those used to optimise the method.
IFCC recommendations provide a framework for patient-based real-time QC development, implementation and performance verification. [3–5]
Stage 4 — Establish an alarm procedure
Before routine implementation, laboratory staff must understand what an alarm means and what action it requires.
A moving-average alarm should not automatically be treated as equivalent to commercial IQC rejection.
The appropriate response depends on the validated QC plan, the magnitude and persistence of the change, and the potential risk to patient results.
The laboratory should also define who reviews the alarm, what evidence must be examined, when affected results should be held, and how the investigation is documented.
Patient-based QC is most useful when an unexpected signal leads to a consistent investigation rather than an improvised response.
7. When Patient-Based QC Raises an Alarm: What Should We Do?
Consider the following illustrative scenario.
A laboratory operates two independent haematology analysers, A and B, processing a similar routine workload.
The laboratory has established separate patient-based moving-average monitoring for each analyser.
Over several monitoring periods, the MCV moving average on Analyser A gradually increases.
Its MCHC moving average falls slightly, while MCH remains relatively stable.
Commercial QC remains acceptable on both analysers.
The patient moving averages on Analyser B remain stable.
The change on Analyser A appeared shortly after a new reagent lot was introduced.
What should we investigate first?
Comparing the two analysers
If both analysers process comparable patient populations, a change affecting only one makes a general patient-mix effect less likely.
But the comparison is useful only if we understand how specimens are distributed.
Urgent or specialised samples may be preferentially routed to one analyser.
The reagent history also matters.
If both analysers received the same new lot, a stable Analyser B argues against a lot-wide reagent effect, although it cannot exclude every reagent-related problem.
If only Analyser A received the new lot, the observed difference may be associated with either the reagent or the analyser.
We must also establish whether the changed reagent could plausibly affect the measurement pathway involved.
Reading the pattern
MCV increasing, MCHC decreasing and MCH remaining stable is consistent with a relative increase in HCT compared with RBC and HGB.
This directs attention towards cell sizing, HCT measurement and related analytical conditions.
However, the averages are calculated separately, so the pattern must be checked against appropriate underlying patient measurements.
It is a troubleshooting clue, not proof of a particular fault.
Where reagent lot-to-lot verification fits
Before a new reagent lot enters routine patient testing, its analytical performance should be assessed according to the laboratory’s approved verification procedure.
CLSI EP26 provides one established framework for evaluating clinically important between-lot differences using patient specimens. [8]
Its two-stage approach separates initial protocol development from subsequent new-lot evaluations.
Patient-based moving-average monitoring serves a different purpose.
It provides ongoing surveillance after implementation.
Patient-based QC does not replace reagent lot verification, and a successfully verified lot does not guarantee that analytical performance will remain unchanged indefinitely.
A structured response
First, review the moving-average data.
Check the number of eligible results, monitoring periods, exclusion rules and sample routing. Establish whether both analysers processed comparable patient populations.
Second, review analytical records.
Examine commercial QC, reagent-lot records, maintenance, calibration history where applicable, and analyser messages.
Third, seek independent confirmation.
Where appropriate, compare suitable patient specimens between analysers or reanalyse retained specimens within a validated stability window.
Use established acceptance criteria to assess any differences.
Finally, assess patient-result risk.
If a meaningful analytical error is confirmed or reasonably suspected, follow the laboratory’s approved procedure for holding affected results, reviewing previously reported results and implementing corrective action.
If the alarm is explained by patient population changes and analytical performance remains acceptable, document the investigation and outcome.
A moving-average alarm alone is not a reason to recalibrate an analyser.
The cause should be investigated before making changes that could obscure the original evidence.
8. What a Moving Average Cannot Tell Us
Patient-based QC has useful strengths, but it also has boundaries.
It cannot reliably detect every analytical error.
A small systematic bias may remain undetected, particularly when the algorithm has limited sensitivity or an insufficient number of eligible patient measurements.
A stable moving average does not prove that every patient result is accurate.
It also does not replace patient-specific checks, commercial internal quality control, appropriate reagent lot verification, external quality assessment, or other elements of the laboratory’s quality assurance system.
And when the moving average changes, the graph cannot independently distinguish a genuine analytical shift from a change in patient population.
That distinction requires investigation.
The main advantage of patient-based QC is not that it supplies a perfect answer.
It provides another opportunity to recognise that an analytical process may be changing while routine testing continues.
The Takeaway
Commercial QC and patient-based monitoring observe analytical performance from different perspectives.
Commercial QC provides structured monitoring against established control-material targets.
Patient moving averages provide additional information from routine patient measurements.
Neither should be interpreted without understanding its limitations.
A moving-average alarm is a reason to ask a better question — not a reason to assume the analyser is wrong.
The value comes from knowing how the monitoring system behaves, recognising when a change matters, and using independent evidence to decide what should happen next.
References
-
Bull BS, Elashoff RM, Heilbron DC, Couperus J. A study of various estimators for the derivation of quality control procedures from patient erythrocyte indices. Am J Clin Pathol. 1974;61(4):473–481. doi:10.1093/ajcp/61.4.473.
-
Cembrowski GS, Westgard JO. Quality control of multichannel hematology analyzers: evaluation of Bull’s algorithm. Am J Clin Pathol. 1985;83(3):337–345. doi:10.1093/ajcp/83.3.337.
-
Badrick T, Bietenbeck A, Cervinski MA, Katayev A, van Rossum HH, Loh TP. Patient-based real-time quality control: review and recommendations. Clin Chem. 2019;65(8):962–971. doi:10.1373/clinchem.2019.305482.
-
Badrick T, Bietenbeck A, Katayev A, van Rossum HH, Loh TP, Cervinski MA. Implementation of patient-based real-time quality control. Crit Rev Clin Lab Sci. 2020;57(8):532–547. doi:10.1080/10408363.2020.1765731.
-
Loh TP, Bietenbeck A, Cervinski MA, van Rossum HH, Katayev A, Badrick T. Recommendation for performance verification of patient-based real-time quality control. Clin Chem Lab Med. 2020;58(8):1205–1213. doi:10.1515/cclm-2019-1024.
-
Sysmex Asia Pacific Pte Ltd. XR-3000: Product Fact Sheet [Internet]. Version 1.0. Singapore: Sysmex Asia Pacific; 2024 [cited 2026 Oct 27]. Available from: https://www.sysmex.co.id/wp-content/uploads/sites/19/2025/04/Sysmex_XR-3000_Product-Fact-Sheet-4pp_LR.pdf
-
Sysmex America. Hematology White Paper — The Influence of RBC Counting Technology on MCHC Results [Internet]. [cited 2026 Oct 27]. Available from: https://www.sysmex.com/training-and-knowledge/knowledge/hematology-white-paper---the-influence-of-rbc-counting
-
CLSI. User Evaluation of Acceptability of a Reagent Lot Change. 2nd ed. CLSI guideline EP26. Clinical and Laboratory Standards Institute; 2022.