You have finished running the morning QC on your haematology analyser.
Three control levels. Several CBC parameters. Most results look fine, but one HGB result has triggered a warning.
A colleague suggests repeating the control.
That might be appropriate. But before reaching for the vial again, there is something worth checking.
Was this a warning or an actual rejection? Did another QC level show a similar problem? And if the analyser really was out of control, what happens to the patient results tested since the last acceptable QC?
Westgard rules help us answer the first two questions. A good laboratory QC procedure must also address the third.
The rules are not simply a way to turn a QC screen from red to green. They are tools for recognising when analytical performance may no longer be reliable.
1. Why “Within ±2 SD” Is Not Always Reassuring
Before interpreting a Westgard rule, we need to know whether the QC limits themselves are suitable.
A result can sit comfortably inside the displayed limits even when the measurement has moved considerably from the laboratory’s usual performance.
Consider a hypothetical HGB control.
| Manufacturer-based limits | Laboratory-established limits | |
|---|---|---|
| Mean | 11.50 g/dL | 11.50 g/dL |
| SD | 0.25 g/dL | 0.10 g/dL |
| Lower 2 SD | 11.00 g/dL | 11.30 g/dL |
| Upper 2 SD | 12.00 g/dL | 11.70 g/dL |
| Current result | 11.83 g/dL | 11.83 g/dL |
| Standardised deviation | +1.32 SD | +3.30 SD |
Illustrative values, not actual laboratory QC data.
The same HGB result is within the wider limits but beyond +3 SD using the laboratory’s established precision.
If the wider SD does not represent the analyser’s actual stable performance, a meaningful analytical change may go unnoticed.
This is why manufacturer assay-sheet ranges should not automatically be treated as appropriate statistical control limits.
The 2024 ICSH guidance for blood cell counters recommends that laboratories assess the limits they use and either apply action limits calculated from their own data, following CLSI H26-A2, or tighten the limits supplied by the manufacturer according to observed analyser performance and the clinical importance of the parameter. The laboratory must document its policy and decisions. [1]
CLSI C24 provides the broader framework for establishing and maintaining a statistical QC strategy. [2]
How much data should we collect?
A commonly recommended starting approach is at least 20 control measurements collected over 10 or more days. Longer observation is preferable when estimating stable analytical performance. [3]
But haematology laboratories face a practical limitation: commercial control lots often have relatively short usable lifetimes.
Imagine introducing a new control lot that will expire in a few months. Waiting several weeks before establishing any usable QC limits may not be practical.
Westgard describes a provisional approach for short-lived haematology controls. [4]
- Obtain approximately 9–16 measurements to estimate the new lot’s mean.
- Combine that mean with an appropriate historical SD from a comparable previous lot to calculate initial control limits.
- Update the mean as another 10–20 measurements become available.
- For controls with approximately 30–90 days of stability, consider pooling precision information from 2–4 successive lots, using suitable weighting when the numbers of observations differ.
These are practical suggestions, not universal minimum requirements. Their suitability depends on the laboratory’s validated method, control material comparability, regulatory requirements and documented SOP.
The key is not to assume that the previous lot’s SD is automatically transferable. It must reasonably represent the analyser’s stable performance.
The opposite problem also deserves attention. An SD that is too narrow or estimated from inadequate data can generate excessive warnings.
At the bench
Before investigating a control result outside the limits, check how those limits were established.
A well-selected rule using an inappropriate SD may give misleading conclusions.
2. Warning Rule vs Rejection Rule: Why 1₂s Triggers So Often
Why do laboratory staff sometimes treat a 1₂s warning as something routine?
Part of the answer is statistical.
For a stable analytical process following a normal distribution, approximately 4.55% of individual QC results are expected to fall outside ±2 SD.
That does not necessarily indicate an analytical problem.
Now consider the number of QC measurements being assessed.
| Number of independent QC measurements | Exact probability of at least one result outside ±2 SD |
|---|---|
| 1 | 4.55% |
| 2 | 8.9% |
| 3 | 13.0% |
| 4 | 17.0% |
| 24 | 67.3% |
Westgard’s widely quoted approximate figures of 9%, 14%, and 18% for N = 2, 3, and 4 come from earlier statistical simulation work. Under an independent normal-distribution model, the calculated values are approximately 8.9%, 13.0%, and 17.0%.
The difference reflects the estimation approach, not a contradiction in the basic statistical principle. [5]
From one parameter to an entire CBC panel
Now imagine a haematology analyser running three control levels across eight CBC parameters.
3 levels × 8 parameters = 24 QC values
If all 24 values were statistically independent:
P(at least one 1₂s) = 1 − (0.9545)²⁴
≈ 67.3%
Even when the analytical system is stable, the probability of seeing at least one warning in this hypothetical set is substantial.
There are two important qualifications.
First, CBC measurements are not statistically independent. HGB, RBC, HCT, MCH and MCHC are related measurements or calculated parameters, and common analytical factors can influence several results together.
Second, the calculation describes the probability of at least one 1₂s event. It is not the false-rejection probability of a properly configured multirule QC procedure.
The actual warning frequency depends on the control limits, statistical distributions, correlations and rules being used.
Nevertheless, the example helps explain why treating every 1₂s warning as an automatic rejection creates unnecessary work.
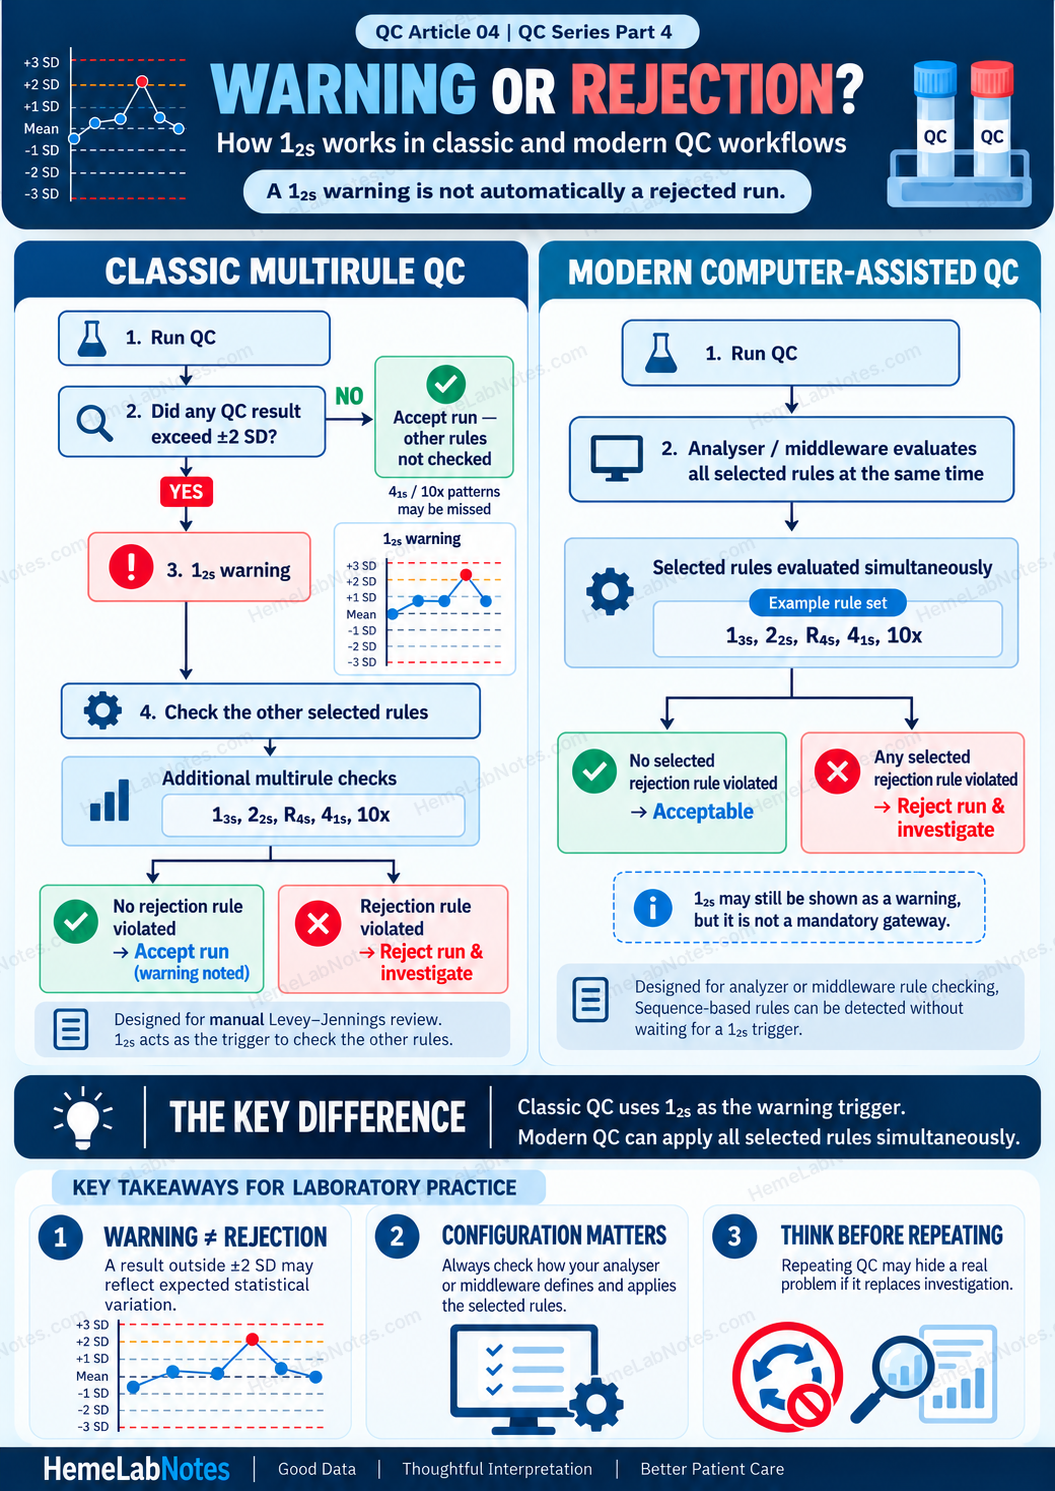
A warning is not automatically a rejection
The original multirule procedure described by Westgard and colleagues in 1981 used 1₂s as a warning criterion before evaluating additional rejection rules. [6]
That distinction helped reduce unnecessary rejection of analytically acceptable runs.
Classic vs modern multirule QC
In the classic workflow, 1₂s acts as the initial warning. When it appears, the operator checks whether any of the other rejection rules have been violated.
This approach was especially useful when Levey–Jennings charts were interpreted manually.
In a modern, computer-assisted workflow, the analyser or middleware can evaluate all selected rejection rules automatically without first requiring a 1₂s warning. [7]
A system may therefore identify a 4₁s or 10x pattern even when no individual result has exceeded ±2 SD.
The 1₂s warning can still be configured if it provides useful information. But it is no longer a mandatory gateway to evaluating the remaining rules.
At the bench
Check whether your analyser or middleware uses a classic warning-triggered procedure or modern simultaneous rule evaluation.
A 1₂s warning does not automatically mean the analytical run must be rejected.
3. Understanding the Classic Westgard Rules
The names are easier to understand when we break them into two parts.
Most describe how many results are involved and how far they lie from the mean.
| Rule | What it detects | Typical interpretation |
|---|---|---|
| 1₂s | One result outside ±2 SD | Warning in classic multirule QC |
| 1₃s | One result outside ±3 SD | Rejection |
| 2₂s | Two consecutive results beyond 2 SD on the same side | Rejection |
| R₄s | Opposite-side control results exceeding +2 SD and −2 SD within a run | Rejection |
| 4₁s | Four consecutive results beyond 1 SD on the same side | Rejection when configured |
| 10x | Ten consecutive results on the same side of the mean | Rejection when configured |
The exact sequence used for counting results must match the laboratory’s selected rule set and analytical-run definition. [7,8]
1₃s: an isolated large deviation
If a control exceeds +3 SD or −3 SD, it violates 1₃s.
This is a rejection criterion, not merely another 1₂s warning.
The result may have several possible explanations, including analytical instability, control-handling problems or instrument-related issues.
The rule indicates that investigation is needed. It does not identify the cause.
2₂s: direction matters
Two consecutive eligible control results must exceed the same 2 SD boundary.
For example:
- First result: +2.3 SD
- Second result: +2.4 SD
This satisfies 2₂s.
But +2.3 SD followed by −2.4 SD does not.
The direction matters.
R₄s: counting rule or calculated range?
R₄s deserves special attention because not all implementations evaluate it in the same way.
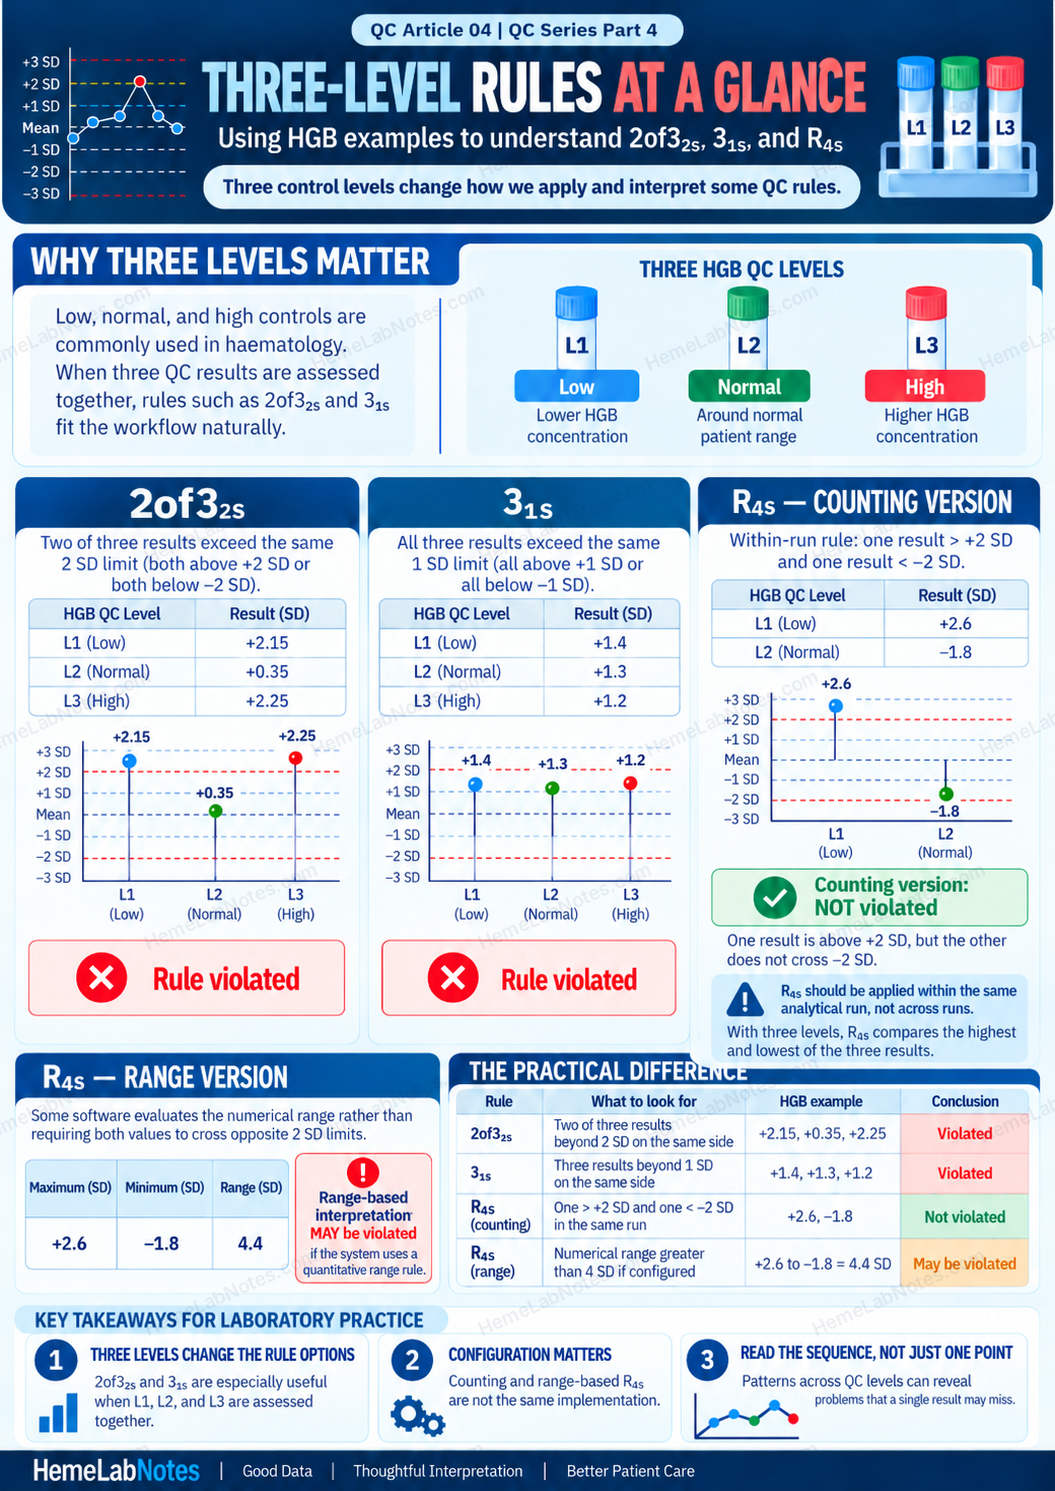
Under the traditional counting-rule interpretation, one QC result must exceed +2 SD while another exceeds −2 SD within the same analytical run.
Consider:
| Control | Standardised result |
|---|---|
| Level 1 | +2.6 SD |
| Level 2 | −1.8 SD |
The numerical difference is:
2.6 − (−1.8) = 4.4 SD
Does this violate R₄s?
Under the traditional counting-rule definition, no. The negative result has not crossed −2 SD.
However, under a separately configured quantitative range rule, a standardised difference exceeding 4 SD could meet the calculated criterion.
This is why two systems can interpret the same results differently if their range-rule implementations are not identical. [5]
For a quantitative range procedure, the comparison threshold must be defined appropriately for the number of measurements evaluated.
R₄s is a within-run rule. It should not be applied across separate analytical runs.
4₁s and 10x: small deviations can accumulate
These rules look for repeated results on the same side of the mean.
Four consecutive eligible observations beyond +1 SD may violate 4₁s.
Ten consecutive observations above the mean may violate 10x.
Neither rule requires an individual result to cross ±2 SD when the selected rules are evaluated simultaneously by modern QC software.
Detailed investigation of shifts, trends and drift belongs in the next QC article.
For now, the important point is that these rules evaluate a sequence rather than a single result.
4. Three QC Levels: What Changes in Haematology?
In haematology laboratories, three-level QC is a familiar workflow.
Low, normal and high controls help monitor analytical performance at different concentrations.
The 2024 ICSH guidance reports that two or three levels are commonly used in practice. It recommends a minimum daily QC approach involving at least two levels and a testing frequency determined by patient workload, analyser stability and risk. It does not require every laboratory to run all three levels at every interval. [1]
When three results are evaluated together, alternative Westgard rule combinations may fit the workflow more naturally than combinations built around pairs of measurements.
One possible three-level combination is:
1₃s / 2of3₂s / R₄s / 3₁s / 6x
Other same-side rules, including 9x or appropriately configured 12x procedures, may also be used. The laboratory should select and validate the rules appropriate to its analytical performance and quality requirements. [7]
Why 2of3₂s?
Imagine one HGB QC run with the following results:
| QC level | HGB deviation |
|---|---|
| L1 — Low | +2.15 SD |
| L2 — Normal | +0.35 SD |
| L3 — High | +2.25 SD |
Two of the three control results exceed +2 SD.
This violates 2of3₂s.
The rule is suited to evaluating how many of the three QC results exceed the same control boundary during the defined assessment.
It does not depend on the order in which L1, L2 and L3 are displayed.
What about 3₁s?
Consider another set of HGB control results:
| QC level | HGB deviation |
|---|---|
| L1 | +1.4 SD |
| L2 | +1.3 SD |
| L3 | +1.2 SD |
All three exceed +1 SD.
None exceeds +2 SD.
If the three results form an eligible sequence under the laboratory’s configured procedure, this satisfies 3₁s.
The decision comes from their combined behaviour, not from an extreme individual result.
Why 6x or 9x?
In a three-level procedure, six consecutive eligible results might span two runs, while nine might span three.
For example, if all three HGB controls fall above their respective means in two consecutive runs, they could form six same-side observations under a procedure combining the levels across runs.
But not every middleware system counts observations in the same way.
Some apply rules separately to each QC level. Others combine results across levels or analytical runs.
Before enabling any multirule combination, confirm how the software defines the sequence.
At the bench
If your analyser runs L1, L2 and L3, do not assume that a two-level textbook example describes exactly how your middleware applies its rules.
Check the configuration.
5. Random vs Systematic Error: What Can Each Rule Detect?
A Westgard rule tells us that a statistical condition has been met.
It does not diagnose a particular instrument fault.
Nevertheless, the pattern can help us decide where to investigate first.
Random error
Random error involves unpredictable variation in measurements.
Possible contributors in a haematology analyser include inconsistent sample aspiration, inadequate mixing, intermittent fluidic disturbances or measurement-system instability.
An isolated 1₃s violation or an R₄s pattern may suggest increased random variation.
However, a large systematic change can also produce a 1₃s result.
The rule is a clue, not proof of the error type.
Systematic error
Systematic error involves a consistent change in analytical measurement behaviour.
Calibration-related changes, reagent effects or measurement-system changes may move results in a particular direction.
Rules such as 2₂s, 2of3₂s, 3₁s, 4₁s and same-side sequence rules can help identify sustained deviations.
A haematology-specific troubleshooting clue
One commercial haematology QC vial can generate several CBC parameters during the same aspiration.
Suppose the L2 control suddenly shows unexpected RBC, HCT, MCV and PLT results, while L1 and L3 remain consistent with their usual performance.
It may be tempting to suspect several different analyser components.
But first consider whether something is wrong with that particular control vial.
Possible explanations include inadequate resuspension, cell settling, deterioration after opening or inappropriate storage.
This does not establish that the control material is faulty. It means the pattern across parameters and QC levels is useful for guiding the investigation.
Consider these hypothetical patterns:
| QC finding | Useful first question |
|---|---|
| Several CBC parameters affected in one QC level | Could the individual control material or its preparation be responsible? |
| HGB shifted in the same direction across all three levels | Could the HGB measurement process have changed? |
| HGB and calculated MCH/MCHC affected while RBC/HCT remain stable | Could a change in measured HGB be influencing the calculated indices? |
MCH and MCHC are calculated using related CBC measurements.
With conventional CBC units:
MCH (pg) = HGB (g/dL) × 10 / RBC (10⁶/µL)
MCHC (g/dL) = HGB (g/dL) × 100 / HCT (%)
A change in HGB may therefore influence both calculated indices even when RBC and HCT remain stable.
Three abnormal parameters do not necessarily represent three independent analytical failures.
That is the value of examining the relationships between results rather than simply counting the flags.
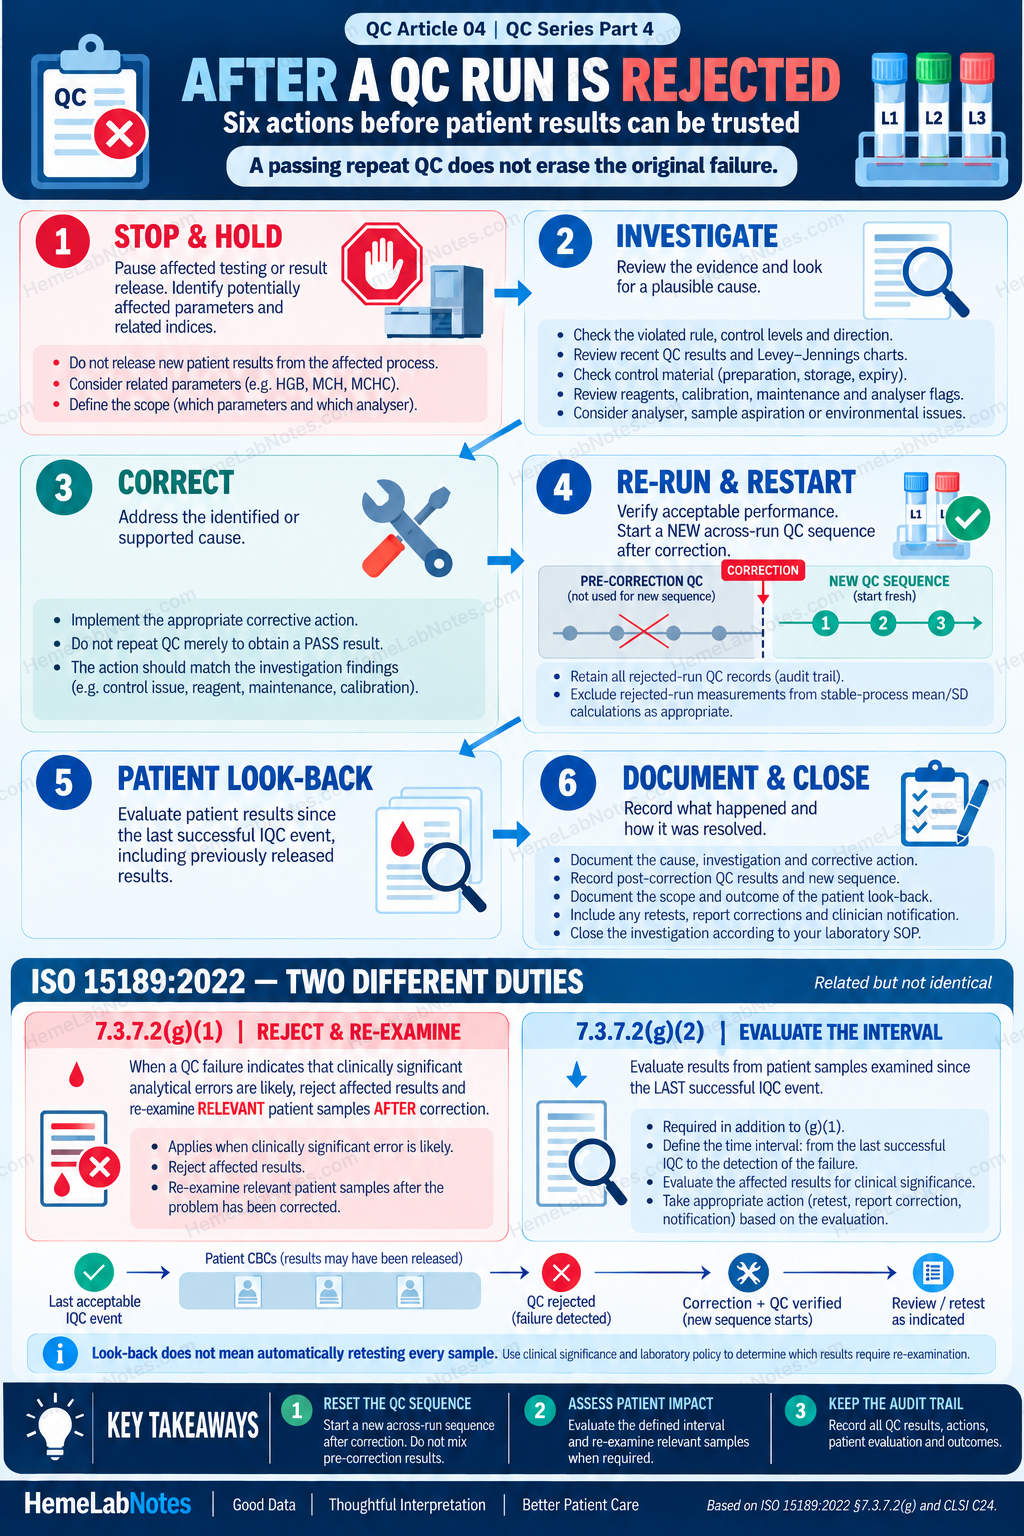
6. When a Rule Is Violated: From Investigation to Patient Look-Back
Once a defined rejection rule has been violated, the laboratory needs more than a successful repeat control.
It needs a structured response.
Step 1 — Stop the affected process
Follow the laboratory’s documented out-of-control procedure.
Prevent inappropriate release of potentially affected patient results while determining which analytical process and parameters may be involved.
A failure involving HGB may also affect MCH and MCHC.
A problem isolated to one particular control level may require a different investigation.
Do not assume that every parameter is affected, but do not dismiss related measurements without assessing them.
Step 2 — Investigate the evidence
Review the current QC results together with recent control history.
Check the violated rule, the affected control levels and the direction of the change.
Then review relevant evidence: control material preparation, storage, reagent changes, calibration, maintenance, analyser flags, aspiration problems and recent analytical events.
The purpose is to identify a plausible cause supported by evidence.
Step 3 — Correct the problem
Correct the identified or sufficiently supported cause.
That may involve preparing appropriate control material, correcting a handling issue, performing indicated maintenance or investigating an analytical component.
Avoid unnecessary recalibration or maintenance merely because a QC result falls outside its limits.
Corrective action should match the findings.
Step 4 — Re-run and establish the corrected control state
After corrective action, run the appropriate controls to demonstrate that the process is performing acceptably.
For rules that use results from previous runs, there is another important consideration.
Do not continue an across-run QC sequence using measurements collected before a rejected run was corrected.
Those measurements may no longer represent the current analytical state.
After correction, the laboratory must accumulate an appropriate new sequence of eligible QC observations. Additional controls may help establish that the corrected process is stable. [8]
What happens to the rejected-run QC data?
Westgard advises excluding the QC observations associated with a rejected analytical run when calculating stable-process mean, SD and CV—even when some observations from that run individually remain within ±2 SD. [4]
For example, consider a defined HGB QC run in which:
- L1 violates 1₃s.
- L2 remains within ±2 SD.
- L3 remains within ±2 SD.
The L2 and L3 observations should not automatically be treated as valid stable-run data simply because they did not individually violate a limit.
The rejected run needs to be handled consistently under the laboratory’s defined QC-statistics policy.
However, all original QC measurements must remain recorded and traceable.
Excluding data from calculations of stable analytical performance is not the same as deleting failed QC results from the analyser, middleware or audit trail.
Step 5 — Patient look-back
This step is particularly important when a QC failure is discovered after patient testing has already occurred.
ISO 15189:2022, Clause 7.3.7.2(g), distinguishes two related responsibilities:
Clause (g)(1): When an IQC failure indicates that clinically significant analytical errors are likely, affected results must be rejected and relevant patient samples re-examined after correction.
Clause (g)(2): Patient results generated after the last successful IQC event must be evaluated. [9]
These requirements are related, but they are not identical.
The look-back assessment must not be omitted simply because the next QC results pass.
A practical HGB scenario
Imagine that an analyser has developed a positive HGB bias of approximately 0.5 g/dL.
The next scheduled QC run identifies the problem.
Several patient CBCs have been processed since the last acceptable QC.
For a patient with a reported HGB of 8.3 g/dL, an error of that magnitude could be clinically relevant, depending on the circumstances.
For a patient with a much higher HGB, the same numerical difference may have a different clinical impact.
Both results belong to the potentially affected interval and require evaluation, although the clinical consequences and subsequent actions may differ.
This is an illustrative example, not an actual patient case or transfusion decision threshold.
The laboratory should determine which results may have been affected, evaluate their clinical significance and ensure relevant samples are re-examined where required.
Depending on the findings, action may include repeat testing, report correction, notification of the clinical team or documented evaluation.
Patient look-back does not mean blindly repeating every sample. It does mean evaluating the potentially affected results and carrying out any re-examination that is required.
CLSI C24 also addresses recovery from out-of-control conditions and the management of potentially erroneous patient results. [2]
Step 6 — Document and close the investigation
The record should establish what happened, which rule was violated, what was investigated, what corrective action was performed and how acceptable performance was demonstrated.
It should also document the scope and outcome of the patient look-back.
A passing QC after corrective action indicates that the current QC measurements meet the selected criteria.
It does not, by itself, establish the cause of the earlier failure or resolve its possible effect on patient results.
7. Why Repeating QC Can Hide the Real Problem
Repeating QC has a place in troubleshooting.
The problem begins when repetition replaces investigation.
Consider a simplified statistical example.
Assume the analytical process has developed a genuine systematic shift of +2 SD.
The remaining random variation is normally distributed, with the same SD as the original stable process.
What is the probability that a fresh QC measurement will fall within the original ±2 SD limits?
Approximately 50%.
That is because the shifted distribution is centred at the original upper 2 SD boundary. About half of the results will fall below that boundary.
Suppose the laboratory repeats the control three times.
If the repeat measurements are independent:
P(at least one result within ±2 SD) = 1 − (1 − 0.5)³
= 87.5%
Even though the systematic shift remains present, there is approximately an 87.5% chance that at least one of the three repeated results will fall within the original ±2 SD limits.
This does not mean the complete multirule QC procedure has passed. It only describes the probability that an individual measurement meets a ±2 SD criterion under the stated assumptions.
The example shows why repeatedly searching for one acceptable value can be misleading.
What has actually changed?
Imagine three repeat results:
| Attempt | Standardised deviation |
|---|---|
| First | +2.8 SD |
| Second | +2.3 SD |
| Third | +1.7 SD |
The third result is within ±2 SD.
But no corrective action has occurred.
We have simply observed a less extreme value.
It would be wrong to treat that third result as proof that the analytical problem has disappeared.
Westgard discussed this practice in his essay Repeated, Repeated, Got Lucky! [10]
The lesson remains relevant to modern automated haematology laboratories.
When every unexpected QC result is repeated until the screen displays PASS, the laboratory may lose sight of an unresolved analytical problem.
At the bench
Repeat QC when there is a justified reason to do so.
But never use repetition as a substitute for investigating a rejected analytical run.
The Takeaway
Westgard rules help us recognise statistical evidence of analytical instability.
But their usefulness depends on more than identifying a 1₃s or 2₂s violation.
We need suitable control limits, a rule set appropriate for the number of QC measurements and an understanding of how our analyser or middleware applies those rules.
For haematology laboratories, three-level controls introduce additional questions about how QC results are combined and evaluated.
A rejected run also raises questions that cannot be answered by the next passing QC result alone.
Was the analytical problem corrected? Have the appropriate across-run sequences been re-established? Were rejected-run QC results handled properly? Could patient results have been affected?
These questions belong to the same quality process.
The aim is not simply to make QC pass.
It is to recognise when we can no longer trust the analytical process—and to restore that confidence with evidence before patient care is affected.
References
-
McCafferty R, Cembrowski G, de la Salle B, Peng M, Urrechaga E. ICSH guidance for internal quality control policy for blood cell counters. Int J Lab Hematol. 2024;46(2):227–233. doi:10.1111/ijlh.14212.
-
Clinical and Laboratory Standards Institute. Statistical Quality Control for Quantitative Measurement Procedures: Principles and Definitions. 4th ed. CLSI guideline C24. Wayne, PA: CLSI; 2016. CLSI C24.
-
Westgard QC. QC — the Practice.
-
Westgard QC. FAQ’s About Controls and Out-of-Controls.
-
Westgard QC. QC — The Chances of Rejection.
-
Westgard JO, Barry PL, Hunt MR, Groth T. A multi-rule Shewhart chart for quality control in clinical chemistry. Clin Chem. 1981;27(3):493–501. doi:10.1093/clinchem/27.3.493.
-
Westgard JO. “Westgard Rules” and Multirules. Westgard QC.
-
Westgard QC. QC — The Multirule Interpretation.
-
International Organization for Standardization. ISO 15189:2022 — Medical laboratories: Requirements for quality and competence. 4th ed. Geneva: ISO; 2022. Clause 7.3.7.2(g). ISO 15189:2022.
-
Westgard JO. Repeated, Repeated, Got Lucky!. Westgard QC; 2001.
Educational note: All numerical examples are illustrative and are not actual patient or laboratory QC data. Laboratories must establish appropriate QC targets, control limits, rule configurations, analytical-run definitions, corrective actions and patient-result review procedures according to their validated performance, applicable standards and SOPs.
HemeLabNotes
Good Data | Thoughtful Interpretation | Better Patient Care
Read the pattern. Then read the patient.