A low MCV tells us that the average red cell is small.
It does not tell us what those cells actually look like.
That difference matters.
Two patients can both have an MCV of 68 fL. One film may show marked anisocytosis, hypochromia, and pencil cells. Another may show a relatively uniform population of small cells with target cells and much less size variation.
Same MCV.
Different morphology.
Different pattern.
The peripheral blood film does not replace the CBC or iron studies. It adds another layer of evidence.
The useful question is:
Does the morphology support the pattern suggested by the CBC?
Start With the CBC Before Looking at the Film
I do not start by searching the film for a particular diagnosis.
I start with the CBC.
For microcytosis, I want to know:
- Is hemoglobin reduced?
- How low is the MCV?
- Is RDW increased or relatively stable?
- Is the RBC count reduced, preserved, or relatively high?
- Is the pattern new or longstanding?
- What do the previous CBCs show?
For the HemeLabNotes examples, microcytosis is defined as:
MCV <78 fL
Laboratories should always use their own validated reference intervals.
The blood film then becomes a way of asking whether the visual morphology agrees with those numbers.
That is different from looking at one abnormal cell and trying to name the disease from it.
Pattern first. Morphology second. Interpretation after correlation.
What the Blood Film Adds
Automated indices summarize the red-cell population.
The film lets us see the population.
That can answer several practical questions.
Are the cells uniformly small?
Is there marked variation in size?
Is central pallor increased?
Are abnormal shapes prominent?
Is there more than one population?
Are inclusions present?
Those observations can strengthen the working interpretation — or show that it does not fit as neatly as expected.
First: Confirm the Microcytic Impression
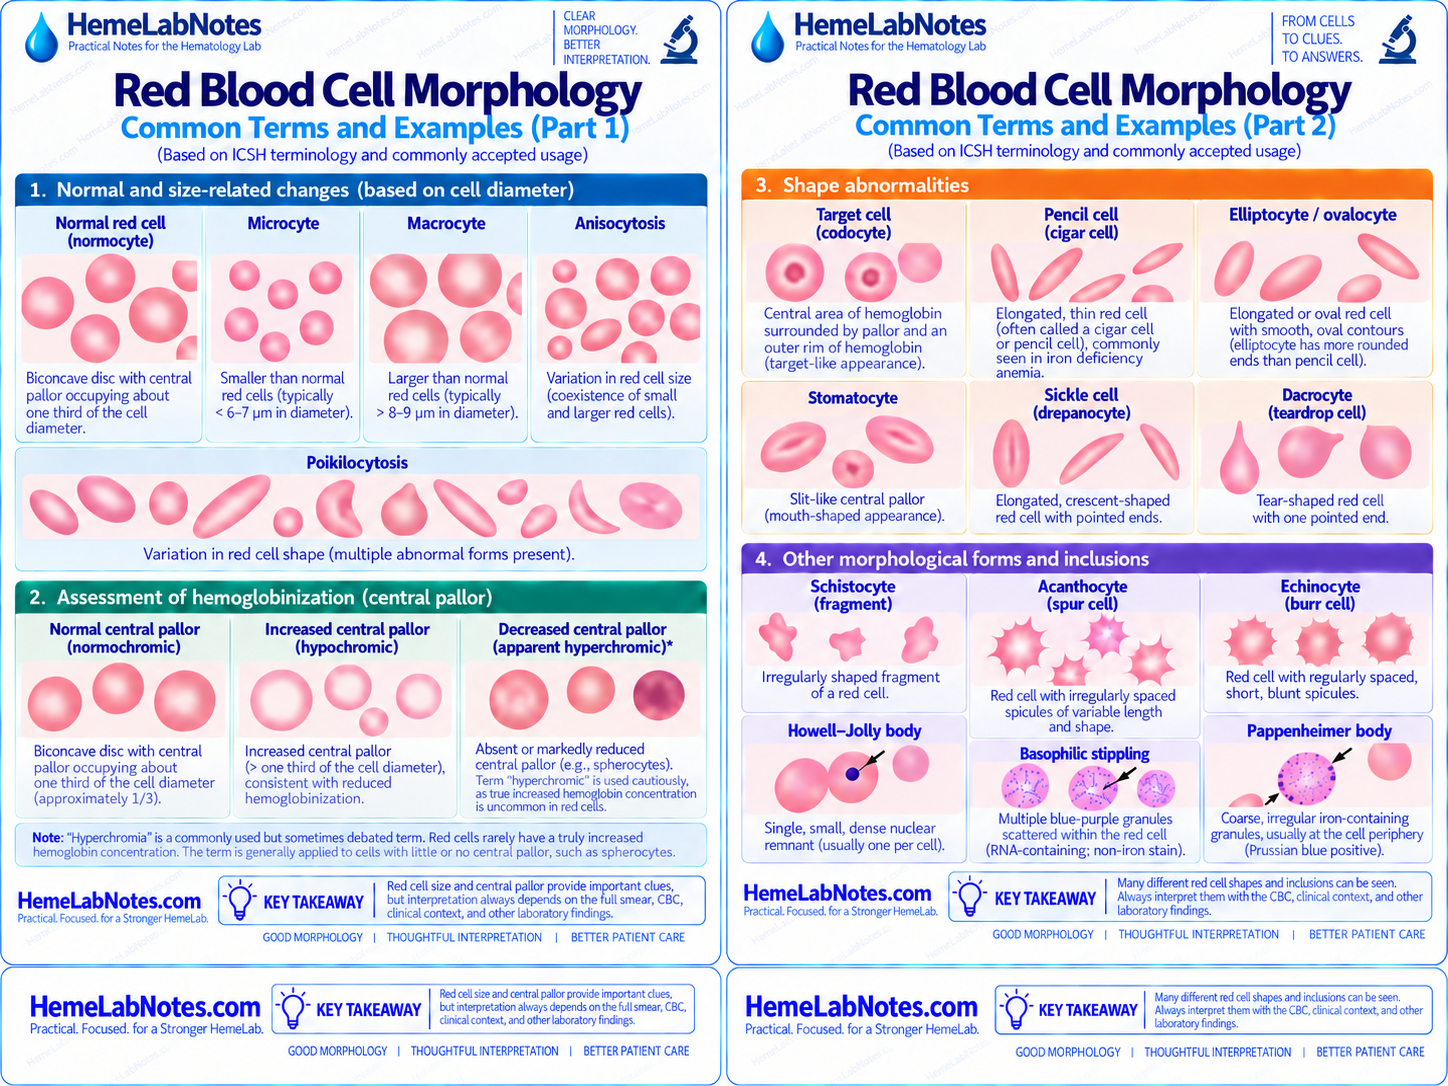
An analyzer may report a low MCV, but the film can show whether the red-cell population actually looks predominantly microcytic.
A microcyte is smaller than a normal mature red cell.
At the microscope, cell size can be estimated by comparison with the nucleus of a nearby small lymphocyte, while remembering that visual estimation is approximate.
But I am not only asking:
“Are the cells small?”
I also want to know:
“Are they all small, or is the population mixed?”
That distinction can matter more.
A relatively uniform population of small cells tells a different story from a film containing very small cells mixed with normal-sized or larger cells.
Look at Central Pallor
After cell size, I look at hemoglobinization.
A normal red cell has central pallor occupying roughly one third of its diameter.
When central pallor is increased, the cell appears hypochromic.
Hypochromia commonly accompanies iron-restricted erythropoiesis, although it is not specific for iron deficiency.
At the opposite end, markedly reduced or absent central pallor may be seen in cells such as spherocytes.
The word hyperchromia is sometimes used for this appearance, but it should be used cautiously. Red cells rarely contain a truly increased hemoglobin concentration beyond their physiological limit; what we often see morphologically is loss of central pallor.
That distinction is worth keeping clear.
Anisocytosis: RDW Made Visible
RDW tells us that red-cell size variation has increased.
The film lets us see that variation directly.
In developing iron deficiency, newer cells may become progressively smaller while older circulating red cells remain larger.
The result is a broader distribution of cell sizes.
On the CBC:
RDW rises.
On the film:
anisocytosis becomes visible.
A relatively stable RDW with a fairly uniform microcytic population may fit better with a longstanding thalassemia-type pattern.
But neither observation is diagnostic by itself.
The film and RDW should tell a compatible story.
If they do not, that discrepancy deserves attention.
Poikilocytosis Tells Us About Shape Variation
Poikilocytosis means variation in red-cell shape.
It is a description, not a diagnosis.
When I see significant poikilocytosis, I want to know which forms dominate.
That is more useful than simply reporting that abnormal shapes are present.
In microcytosis, several forms may be especially helpful as clues.
Pencil Cells and Elliptocytes
Pencil cells are elongated, relatively thin red cells and are commonly associated with iron deficiency.
Elliptocytes and ovalocytes are also elongated cells, but usually have smoother, more rounded contours than classic pencil forms.
The distinction is useful because these terms are sometimes used too loosely.
Pencil cells may support an iron-deficiency pattern when they occur together with:
- microcytosis
- hypochromia
- increased RDW
- compatible iron studies
But again:
A pencil cell is a clue, not a diagnosis.
Elliptocytes can occur in several settings, so the overall pattern remains more important than the individual cell.
Target Cells
Target cells have a central area of hemoglobin surrounded by pallor and an outer rim of hemoglobin.
They are often associated with thalassemia and other hemoglobinopathies, but they are not specific for them.
They may also appear in other settings, including liver disease and some iron-deficient states.
So when target cells appear in a microcytic film, I ask:
- Is the MCV markedly reduced?
- Is the RBC count relatively preserved or high?
- Is RDW relatively stable?
- Are iron studies normal?
- Has this pattern been present for years?
If those findings line up, the target cells strengthen a thalassemia-type interpretation.
They do not establish it.
Basophilic Stippling
Basophilic stippling appears as multiple blue-purple granules scattered through the red cell.
It represents aggregated ribosomal material.
It can occur in thalassemia and several other conditions, including disorders of heme synthesis.
Its importance therefore depends entirely on the context.
If stippling is prominent, I do not use it to name the diagnosis.
I use it as a reason to widen the question.
Why is the stippling present, and does the rest of the case support the same explanation?
Dimorphic Populations Matter
A dimorphic population means that two visibly different red-cell populations are present.
This can be easy to miss when looking only at the MCV because MCV is an average.
For example:
small cells + larger cells
can produce an average MCV that looks much less dramatic than the actual morphology.
A dimorphic population may occur with:
- recent transfusion
- treatment of iron deficiency
- combined nutritional deficiencies
- other mixed erythropoietic processes
The histogram and RDW may also provide clues.
This is one of the situations where the film can explain something that the average MCV cannot.
Iron Deficiency: What Might the Film Add?
A typical iron-deficiency pattern may show:
- microcytosis
- hypochromia
- anisocytosis
- poikilocytosis
- pencil cells
- elliptocytes or ovalocytes
The CBC may show:
- falling hemoglobin
- falling MCV
- increasing RDW
- RBC count that is not relatively preserved
Iron studies then provide the biochemical evidence.
As discussed in Iron Studies in Microcytosis: Do They Fit the Pattern?, low ferritin strongly supports depleted iron stores, but the whole panel and clinical context still matter.
Morphology supports that interpretation.
It does not replace the iron panel.
Thalassemia-Type Pattern: What Might the Film Add?
A thalassemia-type pattern may show:
- marked microcytosis
- hypochromia
- relatively uniform small cells
- target cells
- sometimes basophilic stippling
The CBC often adds an important clue:
the RBC count may remain relatively preserved or high despite marked microcytosis.
That pattern was discussed in RBC Count in Microcytosis: A Useful Clue, Not a Diagnosis.
If the pattern has also remained stable for years and iron studies do not support iron deficiency, a thalassemia-type process becomes more relevant.
But morphology alone still cannot establish the diagnosis.
Hemoglobin analysis or other appropriate testing may be needed depending on the suspected condition.
Iron Deficiency and Thalassemia Can Coexist
This is where neat pattern recognition becomes less reliable.
A patient with a longstanding thalassemia-type pattern can still develop iron deficiency.
Then the film may change.
RDW may increase.
Hypochromia may become more prominent.
The population may become less uniform.
Hemoglobin may fall further.
The RBC count may become less preserved.
If the patient’s current film looks different from previous CBC patterns, do not assume the underlying inherited pattern has suddenly disappeared.
Ask whether something new has been added.
A longstanding pattern does not protect the patient from a new process.
When the Film and Analyzer Do Not Agree
This is one of the most useful reasons to review a film.
Suppose:
- MCV changes abruptly
- RDW rises unexpectedly
- RBC count does not fit the apparent pattern
- the analyzer histogram looks unusual
- the film shows a mixed population
- morphology appears more severe than the indices suggest
That is not a reason to force the morphology into the analyzer result.
It is a reason to investigate the discrepancy.
Check:
- specimen quality
- previous results
- analyzer flags
- histogram or scattergram
- recent transfusion
- treatment history
- possible mixed processes
If the film and analyzer do not agree, investigate the discrepancy — do not force the pattern.
A Practical Way to Read the Film
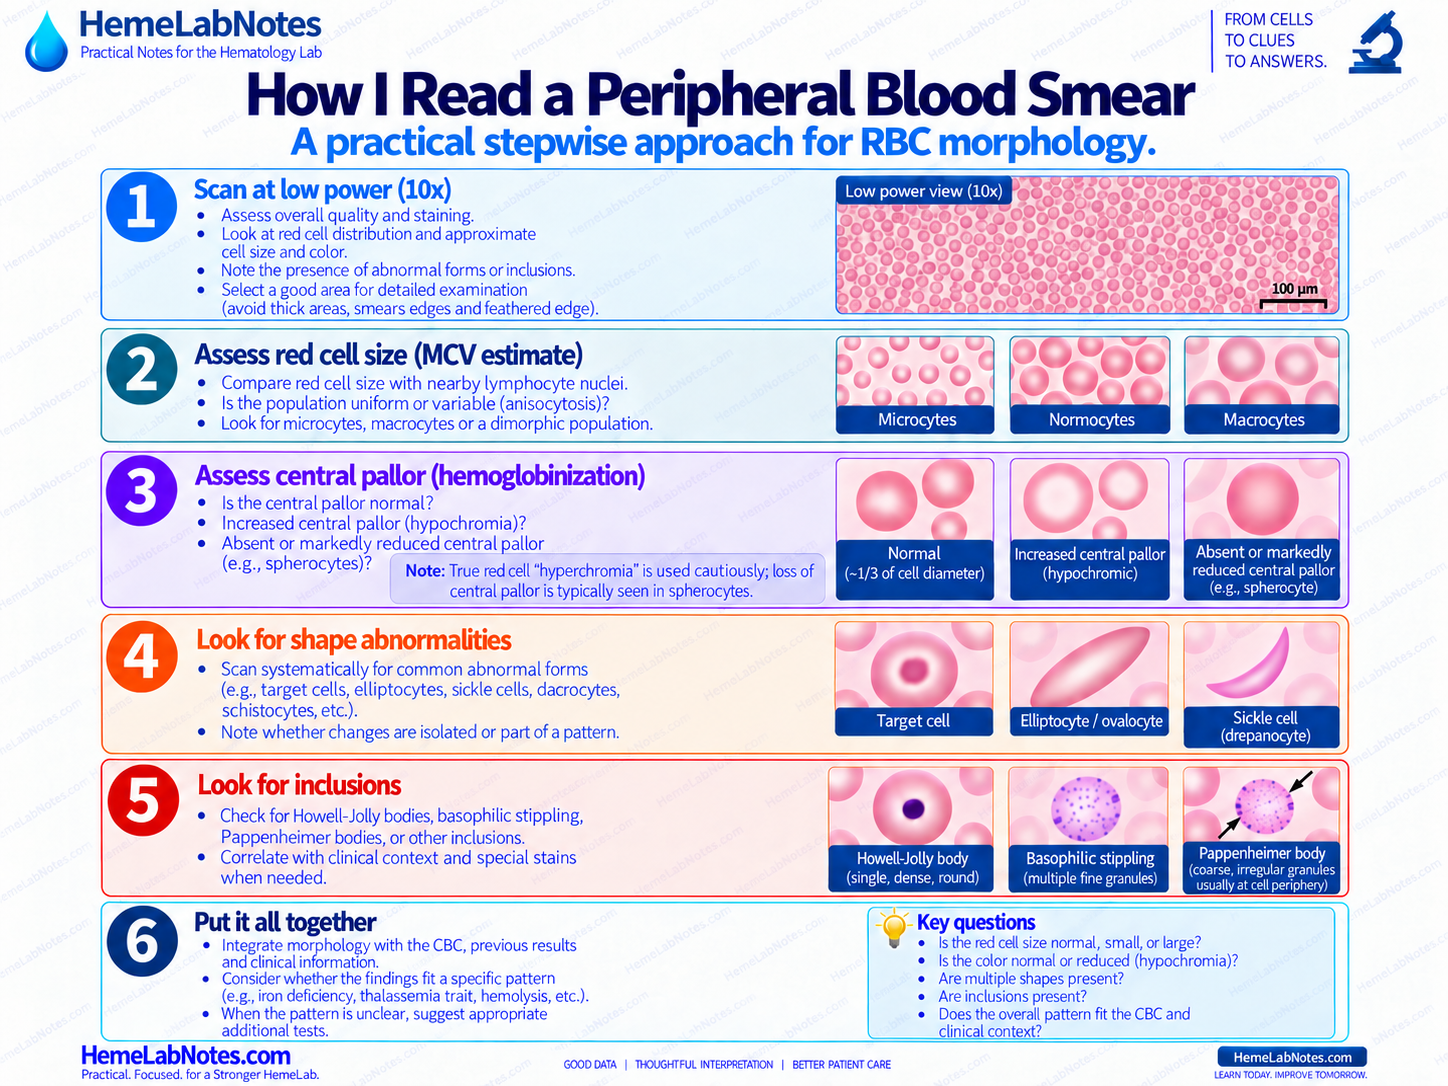
I prefer a repeatable sequence.
Not because every case needs a checklist, but because a consistent order reduces the chance of focusing too early on one striking abnormality.
Step 1: Scan at Low Power
Before concentrating on individual cells, look at the smear as a whole.
Check:
- staining quality
- red-cell distribution
- obvious agglutination or rouleaux
- major size variation
- abnormal populations
- whether the area is suitable for detailed review
Avoid interpreting morphology from an excessively thick area, the extreme feathered edge, or a damaged portion of the smear.
Start with a technically believable field.
Step 2: Assess Red-Cell Size
Ask:
- small?
- normal?
- large?
- uniform?
- variable?
- dimorphic?
In a patient with low MCV, the smear should generally support a microcytic population.
If it does not, that is useful information.
Step 3: Assess Central Pallor
Look for:
- normal central pallor
- increased central pallor consistent with hypochromia
- markedly reduced or absent central pallor
Do not use apparent “hyperchromia” casually.
Loss of central pallor, especially in spherocytes, is more precise morphologically than assuming true excess intracellular hemoglobin concentration.
Step 4: Look for Dominant Shapes
Do not try to name every unusual cell first.
Ask which forms are prominent.
For example:
- target cells
- pencil cells
- elliptocytes / ovalocytes
- dacrocytes
- schistocytes
- sickle cells
- acanthocytes
- echinocytes
Then ask whether those forms fit the rest of the case.
Step 5: Look for Inclusions
Relevant red-cell inclusions may include:
- Howell–Jolly bodies
- basophilic stippling
- Pappenheimer bodies
These findings have different biological meanings.
Pappenheimer bodies, for example, represent coarse iron-containing granules, usually near the cell periphery, and can be confirmed with an iron stain when required.
Do not treat all blue-purple red-cell inclusions as interchangeable.
Step 6: Put It All Together
The final step is not naming the morphology.
It is correlating it.
Ask:
- Does the cell size fit the MCV?
- Does the anisocytosis fit the RDW?
- Does the RBC count support the proposed pattern?
- Do the morphology and iron studies agree?
- Is the pattern new or longstanding?
- Do previous results tell the same story?
- Is there evidence of more than one process?
That is where the film becomes useful.
Not Every Microcytic Sample Needs a Film
A peripheral blood film should add information.
If the CBC pattern is straightforward, technically credible, stable, and already explained by appropriate testing, repeating morphology without a clear question may add little.
The film becomes more valuable when:
- the pattern is unexpected
- the analyzer flags the sample
- CBC parameters disagree
- the result has changed significantly
- a mixed population is suspected
- morphology could influence the next investigation
- laboratory review criteria call for it
The purpose is not to look at every smear.
It is to know when the smear can answer a question the numbers have left open.
Three Bench Examples
Example A — Developing Iron Deficiency
- Hb: decreased
- MCV: 69 fL
- RDW: increased
- RBC count: relatively lower
- ferritin: low
Film:
- microcytosis
- hypochromia
- anisocytosis
- pencil cells
The morphology supports the CBC and iron studies.
The next question is the cause of the iron deficiency.
Example B — Longstanding Thalassemia-Type Pattern
- Hb: near the lower reference interval
- MCV: 67 fL
- RDW: relatively stable
- RBC count: relatively high
- iron studies: not iron deficient
- similar pattern for years
Film:
- marked microcytosis
- relatively uniform cells
- target cells
- occasional basophilic stippling
The film strengthens the pattern.
It does not establish the diagnosis.
Example C — The Pattern Does Not Fit
- Hb: decreased
- MCV: 74 fL
- RDW: markedly increased
- current CBC differs from previous results
Film:
- microcytes
- larger red cells
- marked anisocytosis
- dimorphic population
Now the average MCV is no longer enough.
Ask about:
- recent transfusion
- treatment
- mixed deficiency
- reticulocytosis
- previous results
The film has changed the question.
The Takeaway
A peripheral blood film adds something the MCV cannot:
the appearance of the actual red-cell population.
It shows whether microcytosis is uniform or variable.
It shows the degree of hypochromia.
It reveals anisocytosis, poikilocytosis, dominant shapes, mixed populations, and inclusions.
But none of those findings should stand alone.
The most useful interpretation comes when:
CBC + morphology + iron studies + previous results + clinical context
tell the same story.
And when they do not:
Slow down. The disagreement may be the most important finding.
Morphology is evidence, not diagnosis.
References
-
Palmer L, Briggs C, McFadden S, Zini G, Burthem J, Rozenberg G, et al. ICSH recommendations for the standardization of nomenclature and grading of peripheral blood cell morphological features. Int J Lab Hematol. 2015;37(3):287–303.
-
Bain BJ, Bates I, Laffan MA. Dacie and Lewis Practical Haematology. 12th ed. Elsevier; 2017.
-
Bain BJ. Blood Cells: A Practical Guide. Wiley-Blackwell.
-
Keohane EM, Preston MM, Mirza KM, Walenga JM, eds. Rodak’s Hematology: Clinical Principles and Applications. 7th ed. Elsevier; 2025.